
22 Genetics of phenotypic variation
Learning Objectives
- Explain the relationship between genotype and phenotype and how alleles influence traits.
- Explain why traits governed by multiple genes (polygenic traits) show a range of phenotypic outcomes.
- Define quantitative traits and explain their relationship to polygenic inheritance.
- Describe how both genes and environmental factors contribute to phenotypic variation (multifactorial inheritance).
- Define pleiotropy and explain how a single gene can influence multiple traits.
- Define epistasis and explain how one gene can mask or modify the effect of another.
Genotypes and phenotypes
We have already discussed how the information stored in an organism’s DNA is used to build proteins. In this chapter, we will explore how that molecular process gives rise to the observable traits we see. Think of an organism’s complete set of genetic information, encoded in its DNA, as its genotype. Each instruction within this genotype corresponds to a gene, which often comes in different versions known as alleles. For example, a single gene might provide the instructions for a protein that produces flower color, but it could have an allele that codes for a purple-pigment protein and another that results in a white-pigment protein. The physical trait that is actually expressed, such as the flower being purple, is the phenotype. The phenotype, therefore, is the tangible outcome of the proteins produced by the specific combination of alleles in the genotype. Yet, phenotypes can often be complex, like intricate structures or even behaviors, and they do not follow the one-to-one relationship often presented in classic examples of genetics, like flower color. ,The variation we observe amongst individuals in the population, especially for more complex characteristics is a product of not only differences in their genotype, but also how an individuals genes interact with each other during development as well as the environment.
Genetics of quantitative traits
Most of the phenotypic traits commonly used in introductory genetics are qualitative. This means the phenotype exists in only two (or possibly a few more) discrete, alternative forms, such as purple or white flowers, as noted above. These qualitative traits are therefore said to exhibit discrete variation. Most traits in most organisms, however exhibit continuous variation, meaning they exhibit a continuous range of phenotypes that are usually measured quantitatively, such as height, speed, or flowering time—hence the term, quantitative trait. Even traits that are often taught as being discrete, such as attached/unattached earlobes or flower color, actually exhibit continuous variation. Yet, Many of the quantitative traits we observe in populations are heritable, meaning an offspring’s phenotypes often resemble its parents’ phenotype. The heritability of these complex traits implies that there is an underlying genetic component.
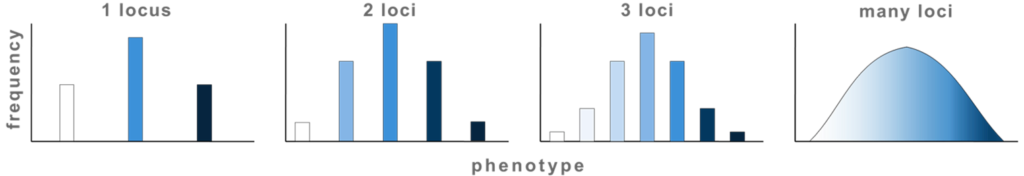
How can genes, which in and of themselves, are discrete entities that produces discrete products (proteins), explain the wide range of continuous variation observed for many traits? The lack of an immediately obvious explanation to this question was one of the early objections to Mendel’s explanation of the mechanisms of heredity. However, upon further consideration, it becomes clear that the more genes that contribute to a trait, the more phenotypic classes may be observed for that trait.
If the number of phenotypic classes is sufficiently large (as with three or more genes), individual classes may become indistinguishable and the phenotype appears as a continuous variation (Figure 1). Thus, quantitative traits are sometimes called polygenic traits, because it is assumed that their phenotypes are controlled by the combined activity of many genes. Note that this does not imply that each of the individual genes has an equal influence on a polygenic trait — some may have a major effect, while others only minor. Furthermore, any single gene may influence more than one trait, whether these traits are quantitative or qualitative traits.
Genetic interactions and phenotypic variation
The simple model of polygenic inheritance, where multiple genes contribute to a trait, can be refined by considering how these genes interact. For many quantitative traits, the effects of different alleles are additive, meaning each allele contributes a small, cumulative amount to the final phenotype. For example, consider kernel color in wheat, which is controlled by several genes. Alleles that produce red pigment contribute to the color’s intensity, so a plant with more “red” alleles will have darker kernels, while one with fewer will have lighter kernels. An individual kernel’s final color is the sum of these small effects, which helps explain the continuous range of colors observed in a population.
However, the path from genotype to phenotype for polygenic traits can be complicated by non-additive interactions between genes.
Pleiotropy
Some genes affect more than one phenotypic trait. This is called pleiotropy. There are numerous examples of pleiotropy in humans. They generally involve important proteins that are needed for the normal development or functioning of more than one organ system. An example of pleiotropy in humans occurs with the gene that codes for the main protein in collagen, a substance that helps form bones. This protein is also important in the ears and eyes. Mutations in the gene result in problems not only in bones but also in these sensory organs, which is how the gene’s pleiotropic effects were discovered.
Another example of pleiotropy occurs with sickle cell anemia. This recessive genetic disorder occurs when there is a mutation in the gene that normally encodes the red blood cell protein called hemoglobin. People with the disorder have two alleles for sickle-cell hemoglobin, so named for the sickle shape (Figure 2) that their red blood cells take on under certain conditions such as physical exertion. The sickle-shaped red blood cells clog small blood vessels, causing multiple phenotypic effects, including stunting of physical growth, certain bone deformities, kidney failure, and strokes.

Dive Deeper
There are lots of examples of pleiotropy in the natural world, including in humans. Learn more about pleiotropy in the following article.
Pleiotropy: One Gene Can Affect Multiple Traits ( Lobo, I. 2008. Nature Education)
Epistasis
In other instances, genes can interact in a way where one gene masks or modifies the phenotypic effect of another. This type of interaction is called epistasis. “Epistasis” is a word composed of Greek roots meaning “standing upon.” The alleles that are being masked or silenced are said to be hypostatic to the epistatic alleles that are doing the masking. Often the biochemical basis of epistasis is a gene pathway in which the expression of one gene is dependent on the function of a gene that precedes or follows it in the pathway.
A classic example of epistasis is coat color in house mice. One gene determines the kind of pigment pattern expressed in the fur (agouti banding or a solid black coat), while a second gene controls whether any pigment is produced at all. If a mouse carries the combination that prevents pigment production, its coat will be white (albino) regardless of whether the first gene specifies agouti or solid black. In this case, the pigment-production gene is epistatic to the pigment-pattern gene, effectively overriding its instructions and altering the expected phenotypes (Figure 3).

Connections to Human Health
Epistatic interactions can contribute to complex diseases in humans. Read the following article to learn about how epistasis was discovered to play critical role in the genetics of the neurodegenerative disease Alzheimer’s.
Epistasis: Gene Interaction and the Phenotypic Expression of Complex Diseases Like Alzheimer’s ( Lobo, I. 2008. Nature Education)
Environmental effects on phenotypic variation
While the combined action of many genes explains how continuous variation can arise from discrete genetic units, it is only part of the story. The relationship between genotype and phenotype is further complicated by the fact that genes do not operate in a vacuum. The environment in which an organism develops and lives implicitly plays a role in shaping the final outcome of its traits. Most phenotypes in nature are not determined solely by genotype. Instead, they result from complex interactions between an individual’s genetic makeup and the environment. In other words, it’s not nature vs. nurture, its nature and nurture. Traits influenced by multiple factors—including various genes and environmental variables—are known as multifactorial traits.
This means that even individuals with the same genotype can exhibit different phenotypes under varying environmental conditions.
Multifactorial traits can be conceptualized using the following relationship:
Genotype × Environment ⇒ Phenotype (G × E ⇒ P)
This equation emphasizes that the phenotype is not just a product of the genotype alone but arises from the dynamic interplay between genetic potential and environmental influences.
Visual Connection
This video explores how your genotype and your environment work together to shape your phenotype. It briefly mentions Mendelian genetics and terms like homozygous and heterozygous, which we will learn more about in a later chapter.
Many common diseases are multifactorial, influenced by both genetic predispositions and environmental exposures. For instance, certain alleles may increase an individual’s susceptibility to developing type 2 diabetes, but lifestyle factors such as diet, physical activity, and body weight heavily influence whether the disease actually manifests. This means that individuals with a genetic predisposition can potentially prevent or delay the onset of the disease by adopting healthier lifestyle choices.
Similarly, cancer development is often a multifactorial process. While some cancers are driven by inherited genetic mutations (e.g., BRCA1 and BRCA2 genes associated with breast cancer), many others result from interactions between genetic susceptibilities and environmental exposures to carcinogens. For example, a person with a genetic predisposition to lung cancer may only develop the disease if they are exposed to carcinogens like tobacco smoke or air pollutants. Therefore, not all individuals with the susceptibility genotype will develop the cancer phenotype; environmental factors play a key role in determining the outcome.
In agriculture, understanding genotype-environment interactions is essential for improving crop yields and livestock productivity. Farmers and breeders select for genotypes that perform well under specific environmental conditions. For example, developing drought-resistant crop varieties involves selecting plants with genotypes that allow them to thrive in arid conditions. However, even the best genotypes may fail to produce optimal phenotypes if environmental conditions are unfavorable, such as poor soil quality or extreme temperatures.
This genotype-environment interaction is particularly significant for polygenic traits, which are controlled by multiple genes, each contributing a small effect to the phenotype. For example, skin color in humans is a polygenic trait with a wide range of variation among individuals and populations worldwide. Genetic differences in melanin production and distribution account for much of this diversity. However, environmental exposure to ultraviolet (UV) radiation from sunlight can also affect skin color by stimulating the production of melanin, the pigment responsible for skin coloration. This process, known as tanning, is a protective response against DNA damage caused by UV light. As illustrated in Figure 2, increased exposure to UV light leads to the darkening of the skin, demonstrating how the environment can influence phenotype by modulating gene expression.

Environmental factors can influence phenotypes not only by interacting with genetic predispositions but also by affecting gene expression through mechanisms such as epigenetics. Epigenetic modifications involve changes in gene activity without altering the underlying DNA sequence. These modifications can be triggered by environmental factors like diet, stress, and exposure to toxins, leading to changes in how genes are expressed.
An illustrative case is the Dutch Hunger Winter of 1944–1945, where severe famine conditions led to long-term health effects in individuals who were in utero during the famine. Studies have shown that these individuals had epigenetic changes in genes related to growth and metabolism, resulting in increased rates of obesity, cardiovascular disease, and other health issues in adulthood. This example underscores the significant impact that environmental factors can have on gene expression and phenotype, even across generations.
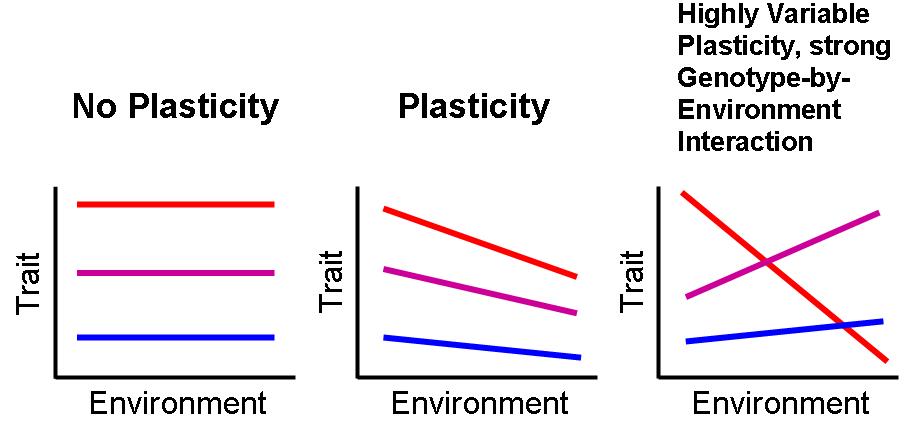
Another important concept in understanding genotype-environment interactions is the norm of reaction, which describes the range of phenotypes that can be produced by a single genotype under different environmental conditions. This concept highlights the idea of phenotypic plasticity, the ability of an organism to alter its phenotype in response to environmental changes (Figure 3).
For example, the water flea Daphnia can develop protective spines when exposed to chemical cues from predators during development. Genetically identical Daphnia raised without these cues do not develop spines. This demonstrates how the same genotype can lead to different phenotypes depending on environmental conditions.
In plants, genetically identical individuals can exhibit significant variations in traits like height, leaf size, and flowering time based on environmental factors such as light availability, water, and nutrient supply. Understanding phenotypic plasticity is critical for predicting how organisms may respond to environmental changes, such as those resulting from climate change.
Lecture Video: Polygenic inheritance, quantitative traits, pleiotropy, and gene-environment interactions
Glossary
Continuous Variation: A type of variation where traits show a continuous range of phenotypes from one extreme to another (e.g., human height).
Discrete Variation: A type of variation where traits fall into distinct, separate categories with no intermediate forms (e.g., purple or white flowers).
Epigenetics: The study of heritable changes in gene expression that occur without altering the underlying DNA sequence.
Epistasis: A type of gene interaction where the phenotypic effect of one gene is masked or modified by the effect of one or more other genes.
Genotype: The complete set of genetic material and information encoded in an organism’s DNA.
Loci: A physical region on a chromosome that contains one or more genes.
Multifactorial Trait: A trait that is influenced by multiple genes as well as environmental factors.
Norm of Reaction: The pattern of phenotypic expression of a single genotype across a range of environments.
Phenotype: The observable characteristics of an organism, such as its appearance, development, and behavior, which result from the interaction of its genotype and the environment.
Phenotypic Plasticity: The ability of a single genotype to produce different phenotypes in response to different environmental conditions.
Pleiotropy: A situation where a single gene influences multiple, seemingly unrelated phenotypic traits.
Polygenic Trait: A trait that is controlled by the combined effects of multiple genes.
Quantitative Trait: A measurable phenotype that depends on the cumulative actions of many genes and their interaction with the environment. These traits typically show continuous variation.
Citations and References
- Clark, M.A., Douglas, M., and Choi, J. 2018. Biology 2e. OpenStax. Retrieved from https://openstax.org/books/biology-2e/
- Lobo, I. (2008) Epistasis: Gene interaction and the phenotypic expression of complex diseases like Alzheimer’s. Nature Education 1(1):180
- Lobo, I. (2008) Pleiotropy: One Gene Can Affect Multiple Traits. Nature Education 1(1):10
