
30 Population Genetics: Hardy-Weinberg Equilibrium
By the end of this section, you will be able to:
- Define population genetics and describe how scientists use population genetics in studying population evolution
- Define the Hardy-Weinberg principle and discuss its importance
Lecture Video: Review of population genetics
Hardy-Weinberg Principle of Equilibrium
In the early twentieth century, English mathematician Godfrey Hardy and German physician Wilhelm Weinberg stated the principle of equilibrium to describe the population’s genetic makeup. The theory, which later became known as the Hardy-Weinberg principle of equilibrium, states that a population’s allele and genotype frequencies are inherently stable— unless some kind of evolutionary force is acting upon the population, neither the allele nor the genotypic frequencies would change. The Hardy-Weinberg principle assumes conditions with no mutations, migration, emigration, or selective pressure for or against genotype, plus an infinite population. While no population can satisfy those conditions, the principle offers a useful model against which to compare real population changes.
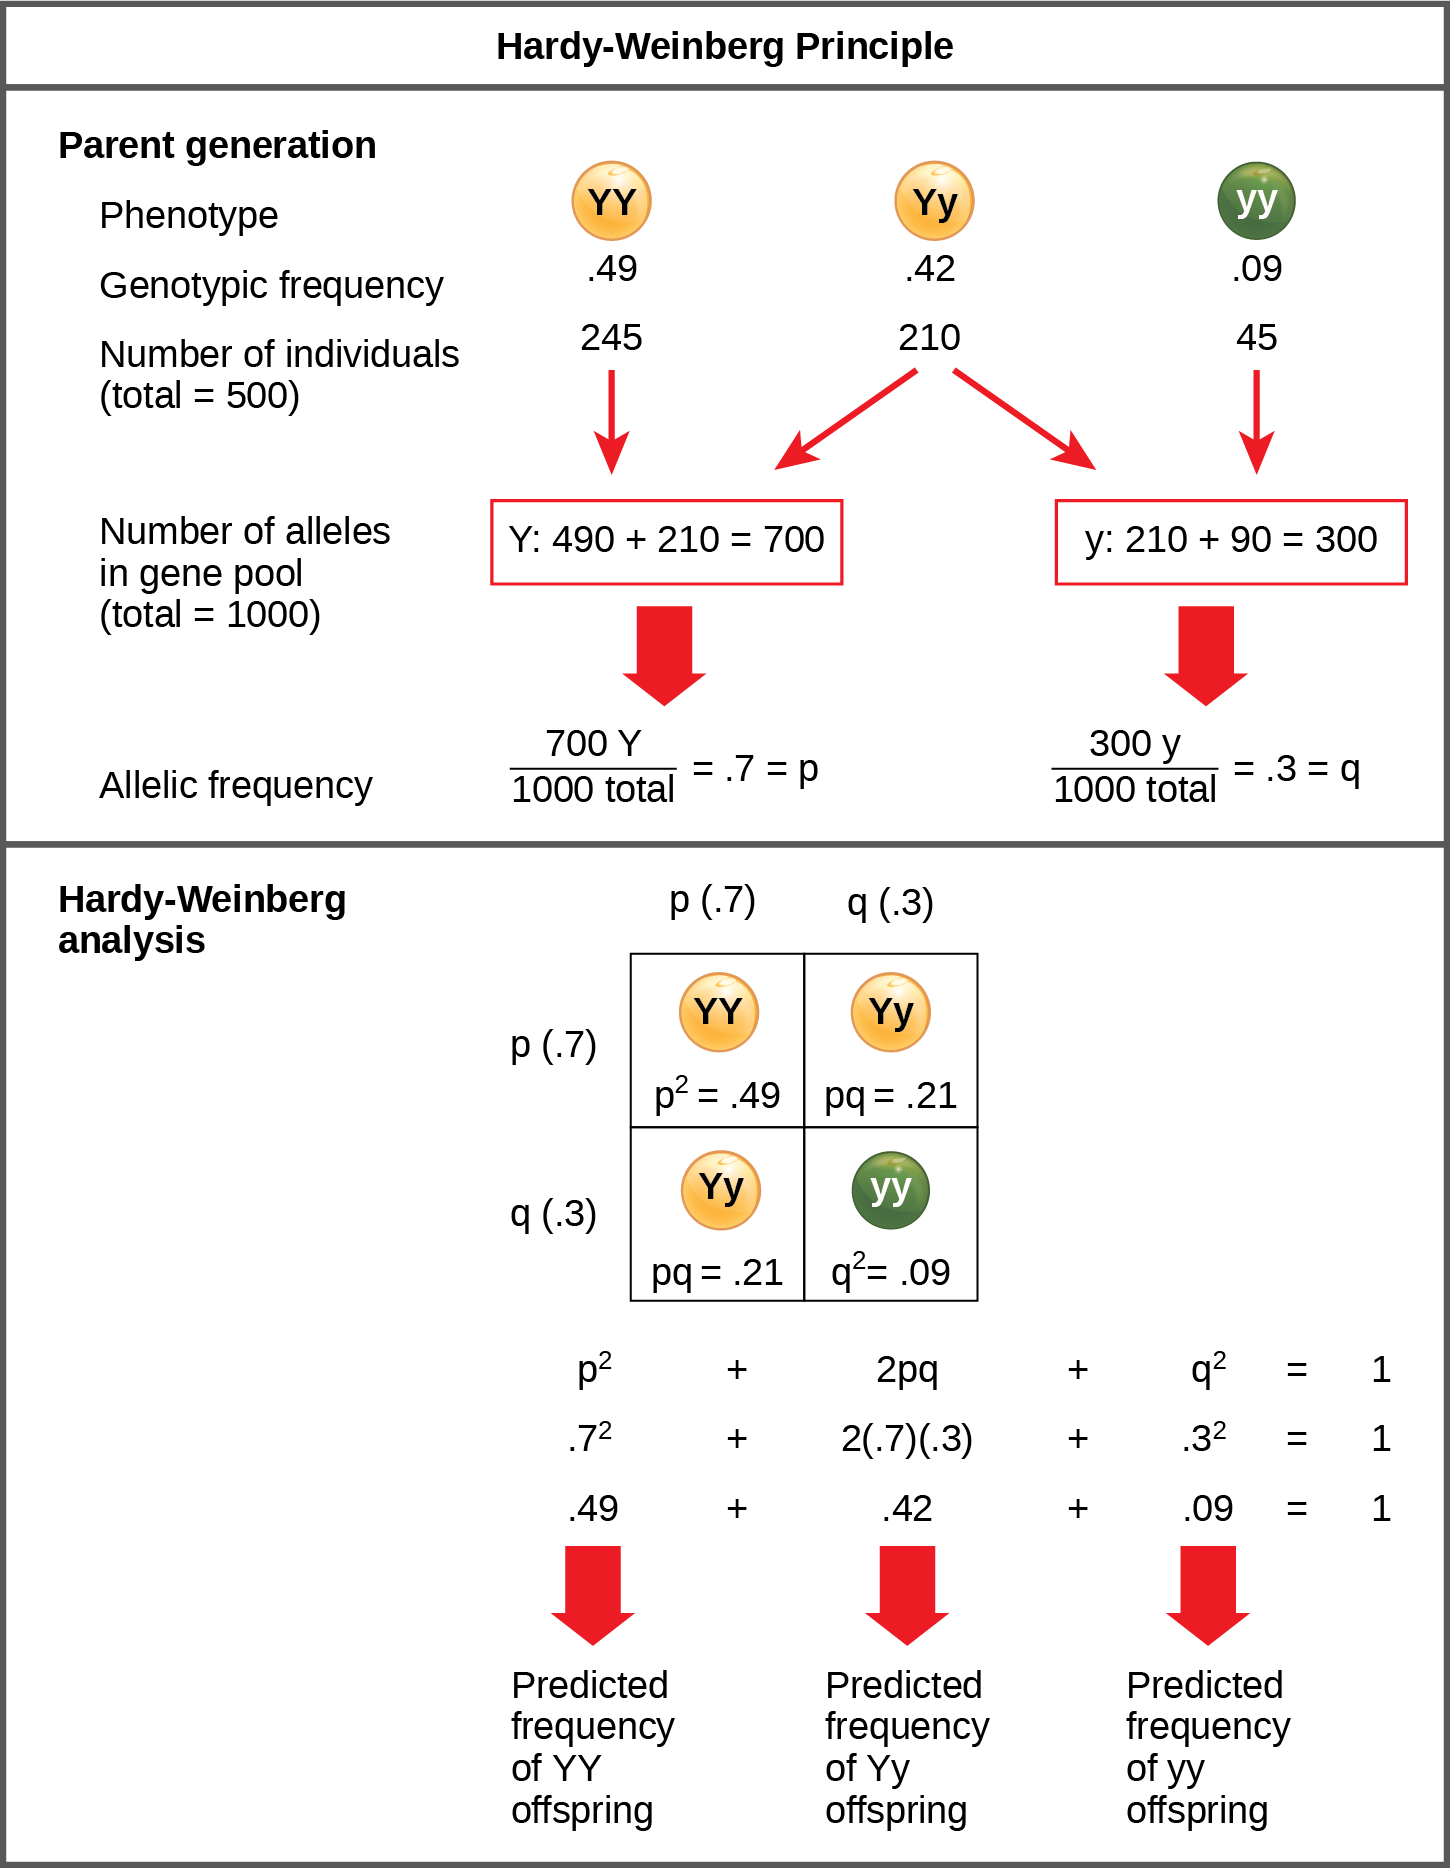
Working under this theory, population geneticists represent different alleles as different variables in their mathematical models. The variable p, for example, often represents the frequency of a particular allele, say Y for the trait of yellow in Mendel’s peas, while the variable q represents the frequency of y alleles that confer the color green. If these are the only two possible alleles for a given locus in the population, p + q = 1. In other words, all the p alleles and all the q alleles comprise all of the alleles for that locus in the population.
However, what ultimately interests most biologists is not the frequencies of different alleles, but the frequencies of the resulting genotypes, known as the population’s genetic structure, from which scientists can surmise phenotype distribution. If we observe the phenotype, we can know only the homozygous recessive allele’s genotype. The calculations provide an estimate of the remaining genotypes. Since each individual carries two alleles per gene, if we know the allele frequencies (p and q), predicting the genotypes’ frequencies is a simple mathematical calculation to determine the probability of obtaining these genotypes if we draw two alleles at random from the gene pool. In the above scenario, an individual pea plant could be pp (YY), and thus produce yellow peas; pq (Yy), also yellow; or qq (yy), and thus produce green peas (Figure 1). In other words, the frequency of pp individuals is simply p2; the frequency of pq individuals is 2pq; and the frequency of qq individuals is q2. Again, if p and q are the only two possible alleles for a given trait in the population, these genotypes frequencies will sum to one: p2 + 2pq + q2 = 1.
VISUAL CONNECTION
In plants, violet flower color (V) is dominant over white (v). If p = 0.8 and q = 0.2 in a population of 500 plants.
- How many individuals would you expect to be homozygous dominant (VV), heterozygous (Vv), and homozygous recessive (vv)?
- How many plants would you expect to have violet flowers, and how many would have white flowers?
Answers:
1. The expected distribution is 320 VV, 160Vv, and 20 vv plants. Plants with VV or Vv genotypes would have violet flowers, and plants with the vv genotype would have white flowers.
2. A total of 480 plants would be expected to have violet flowers, and 20 plants would have white flowers.
In theory, if a population is at equilibrium—that is, there are no evolutionary forces acting upon it—generation after generation would have the same gene pool and genetic structure, and these equations would all hold true all of the time. Of course, even Hardy and Weinberg recognized that no natural population is immune to evolution. Populations in nature are constantly changing in genetic makeup due to drift, mutation, possibly migration, and selection. As a result, the only way to determine the exact distribution of phenotypes in a population is to go out and count them. However, the Hardy-Weinberg principle gives scientists a mathematical baseline of a non-evolving population to which they can compare evolving populations and thereby infer what evolutionary forces might be at play. If the frequencies of alleles or genotypes deviate from the value expected from the Hardy-Weinberg equation, then the population is evolving.
Lecture Videos:
Hardy-Weinberg Equilibrium
Persistence of recessive alleles
Maintenance of Genetic Diversity
VISUAL CONNECTION
Footnotes
- 1 Sahar S. Hanania, Dhia S. Hassawi, and Nidal M. Irshaid, “Allele Frequency and Molecular Genotypes of ABO Blood Group System in a Jordanian Population,” Journal of Medical Sciences 7 (2007): 51-58, doi:10.3923/jms.2007.51.58.
Glossary
- allele frequency
- (also, gene frequency) rate at which a specific allele appears within a population
- founder effect
- event that initiates an allele frequency change in part of the population, which is not typical of the original population
- gene pool
- all the alleles that the individuals in the population carry
- genetic structure
- distribution of the different possible genotypes in a population
- Hardy-Weinberg equilibrium
- a population’s allele and genotype frequencies will remain the same unless an evolutionary force (such as genetic drift or natural selection) is acting upon the population
- macroevolution
- broader scale evolutionary changes that scientists see over paleontological time
- microevolution
- changes in a population’s genetic structure
- modern synthesis
- overarching evolutionary paradigm that took shape by the 1940s and scientists generally accept today
- population genetics
- study of how selective forces change the allele frequencies in a population over time
Access for free at https://openstax.org/books/biology-2e/pages/1-introduction
