
Common Questions You Can Answer with Canvas Learning Analytics
6. Which quiz questions did my students struggle with the most?
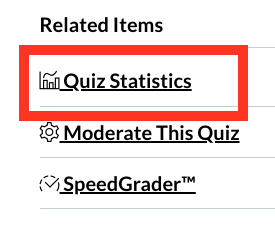
Canvas provides additional details about quiz questions that can help you determine which quiz questions your students struggle with. Go to Quizzes and click on the specific quiz link. In the upper right corner select Quiz Statistics.
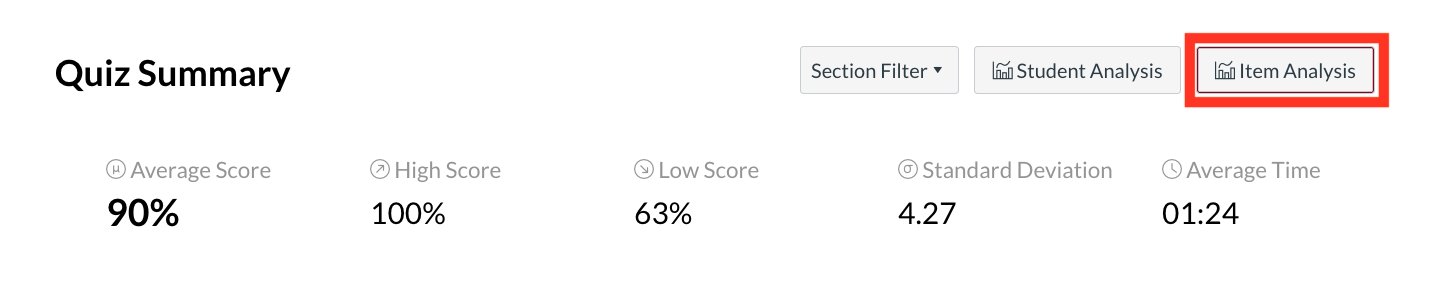
The Quiz Summary on the Quiz Statistics screen shows Average Score, High Score, Low Score, Standard Deviation (how far the values are spread across the entire score range), and Average Time of quiz completion. After the quiz has been administered, instructors automatically have access to those results, which can be sorted by Student Analysis or Item Analysis.
Item Analysis shows how, if at all, students struggled with the quiz questions. On the Quiz Statistics screen, click on the Item Analysis button in the upper right corner.
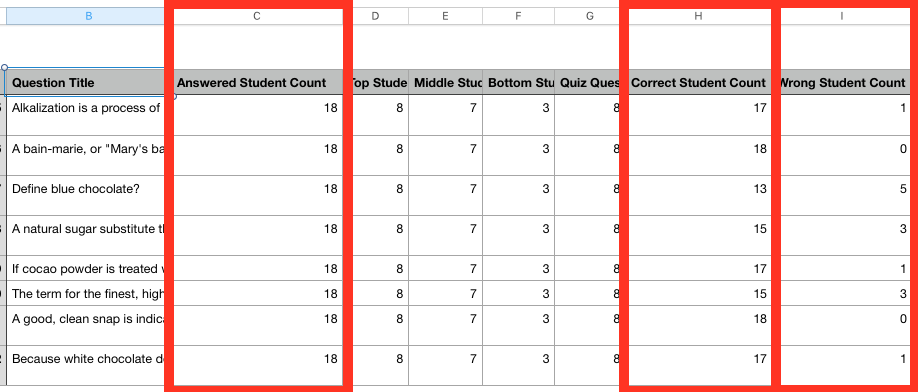
The quiz data will be downloaded to your computer as a .csv file:
- Column C numbers show how many students replied to a specific question
- Column H indicates how many students answered this question correctly
- Column I indicates how many students answered this question wrong
Related Resources
