Community Ecology
Matthew R. Fisher and Editor
Populations typically do not live in isolation from other species. Populations that interact within a given habitat form a community. The number of species occupying the same habitat and their relative abundance is known as the diversity of the community. Areas with low species diversity, such as the glaciers of Antarctica, still contain a wide variety of living organisms, whereas the diversity of tropical rainforests is so great that it cannot be accurately assessed. Scientists study ecology at the community level to understand how species interact with each other and compete for the same resources.
Predation and Herbivory
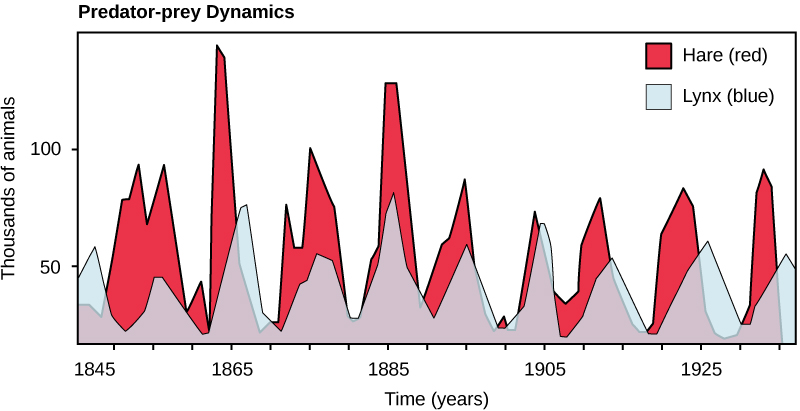
Perhaps the classical example of species interaction is the predator-prey relationship. The narrowest definition of predation describes individuals of one population that kill and then consume the individuals of another population. Population sizes of predators and prey in a community are not constant over time, and they may vary in cycles that appear to be related. The most often cited example of predator-prey population dynamics is seen in the cycling of the lynx (predator) and the snowshoe hare (prey), using 100 years of trapping data from North America (Figure 1). This cycling of predator and prey population sizes has a period of approximately ten years, with the predator population lagging one to two years behind the prey population. An apparent explanation for this pattern is that as the hare numbers increase, there is more food available for the lynx, allowing the lynx population to increase as well. When the lynx population grows to a threshold level, however, they kill so many hares that hare numbers begin to decline, followed by a decline in the lynx population because of scarcity of food. When the lynx population is low, the hare population size begins to increase due, in part, to low predation pressure, starting the cycle anew.
Defense Mechanisms against Predation and Herbivory
Predation and predator avoidance are strong influenced by natural selection. Any heritable character that allows an individual of a prey population to better evade its predators will be represented in greater numbers in later generations. Likewise, traits that allow a predator to more efficiently locate and capture its prey will lead to a greater number of offspring and an increase in the commonness of the trait within the population. Such ecological relationships between specific populations lead to adaptations that are driven by reciprocal evolutionary responses in those populations. Species have evolved numerous mechanisms to escape predation (including herbivory, the consumption of plants for food). Defenses may be mechanical, chemical, physical, or behavioral.
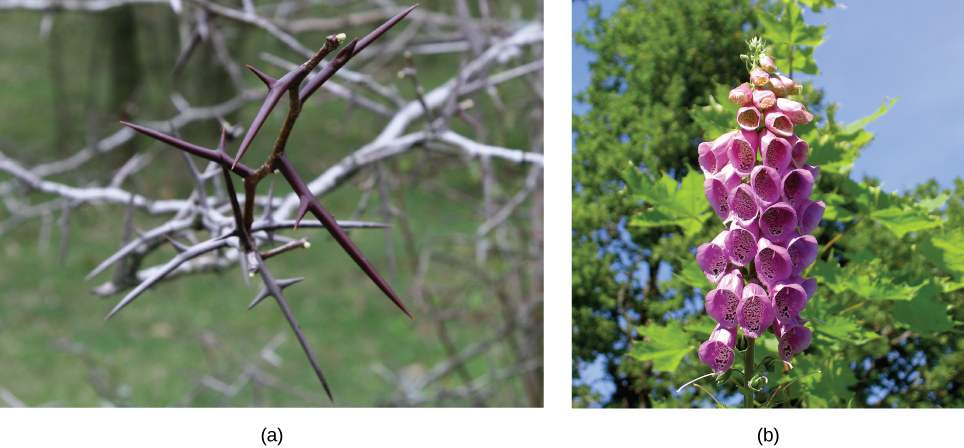
Mechanical defenses, such as the presence of armor in animals or thorns in plants, discourage predation and herbivory by discouraging physical contact (Figure 2a). Many animals produce or obtain chemical defenses from plants and store them to prevent predation. Many plant species produce secondary plant compounds that serve no function for the plant except that they are toxic to animals and discourage consumption. For example, the foxglove produces several compounds, including digitalis, that are extremely toxic when eaten (Figure 2b). (Biomedical scientists have repurposed the chemical produced by foxglove as a heart medication, which has saved lives for many decades.)
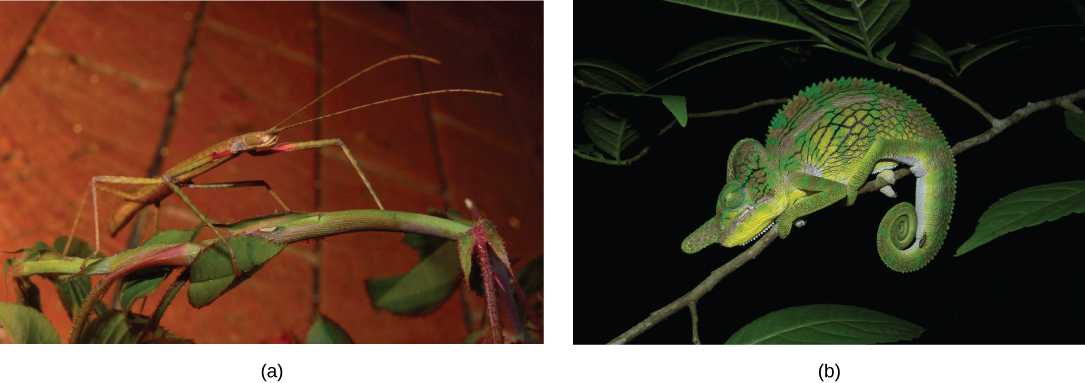
Many species use their body shape and coloration to avoid being detected by predators. The tropical walking stick is an insect with the coloration and body shape of a twig, which makes it very hard to see when it is stationary against a background of real twigs (Figure 3a). In another example, the chameleon can change its color to match its surroundings (Figure 3b).
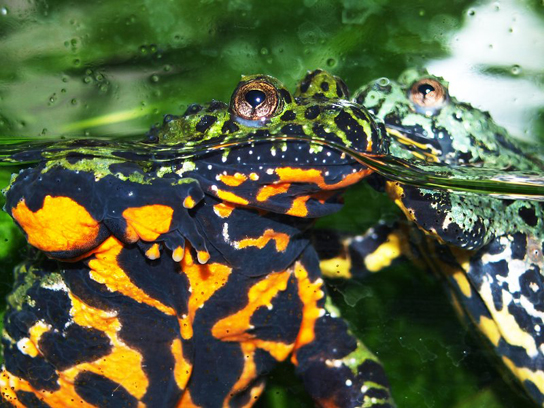
Some species use coloration as a way of warning predators that they are distasteful or poisonous. For example, the monarch butterfly caterpillar sequesters poisons from its food (plants and milkweeds) to make itself poisonous or distasteful to potential predators. The caterpillar is bright yellow and black to advertise its toxicity. The caterpillar is also able to pass the sequestered toxins on to the adult monarch, which is also dramatically colored black and red as a warning to potential predators. Fire-bellied toads produce toxins that make them distasteful to their potential predators (Figure 4). They have bright red or orange coloration on their bellies, which they display to a potential predator to advertise their poisonous nature and discourage an attack. Warning coloration only works if a predator uses eyesight to locate prey and can learn—a naïve predator must experience the negative consequences of eating one before it will avoid other similarly colored individuals.
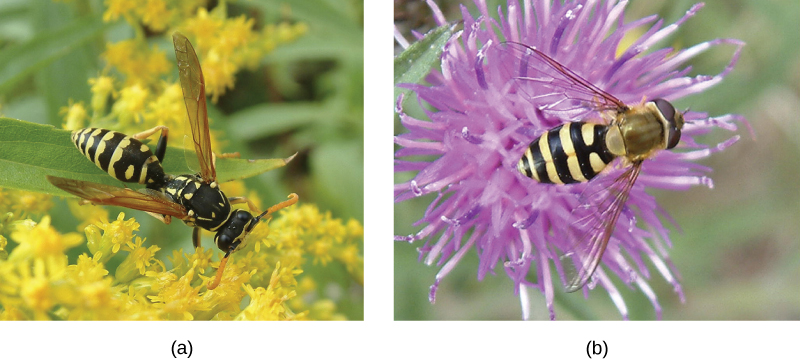
While some predators learn to avoid eating certain potential prey because of their coloration, other species have evolved mechanisms to mimic this coloration to avoid being eaten, even though they themselves may not be unpleasant to eat or contain toxic chemicals. In some cases of mimicry, a harmless species imitates the warning coloration of a harmful species. Assuming they share the same predators, this coloration then protects the harmless ones. Many insect species mimic the coloration of wasps, which are stinging, venomous insects, thereby discouraging predation (Figure 5).
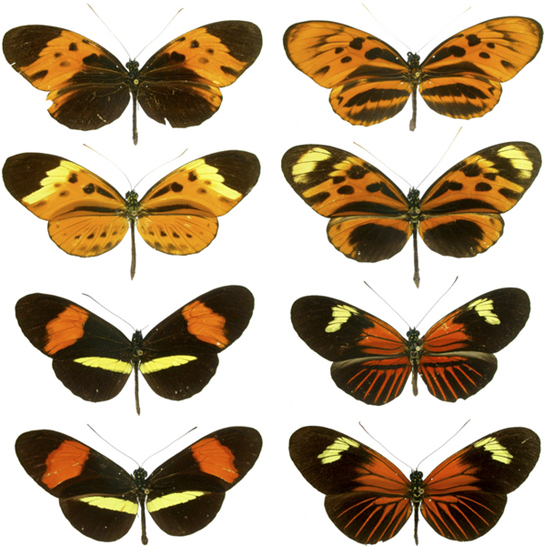
In other cases of mimicry, multiple species share the same warning coloration, but all of them actually have defenses. The commonness of the signal improves the compliance of all the potential predators. Figure 6 shows a variety of foul-tasting butterflies with similar coloration.

Competitive Exclusion Principle
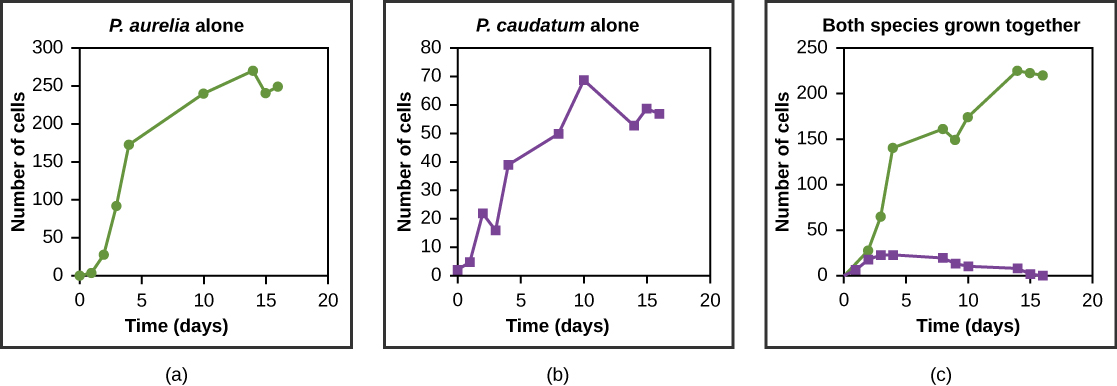
Resources are often limited within a habitat and multiple species may compete to obtain them. Ecologists have come to understand that all species have an ecological niche: the unique set of resources used by a species, which includes its interactions with other species. The competitive exclusion principle states that two species cannot occupy the exact same niche in a habitat. In other words, different species cannot coexist in a community if they are competing for all the same resources. It is important to note that competition is bad for both competitors because it wastes energy. The competitive exclusion principle works because if there is competition between two species for the same resources, then natural selection will favor traits that lessen reliance on the shared resource, thus reducing competition. If either species is unable to evolve to reduce competition, then the species that most efficiently exploits the resource will drive the other species to extinction. An experimental example of this principle is shown in Figure 7 with two protozoan species: Paramecium aurelia and Paramecium caudatum. When grown individually in the laboratory, they both thrive. But when they are placed together in the same test tube (habitat), P. aurelia outcompetes P. caudatum for food, leading to the latter’s eventual extinction.
Symbiosis
Symbiotic relationships are close, long-term interactions between individuals of different species. Symbioses may be commensal, in which one species benefits while the other is neither harmed nor benefited; mutualistic, in which both species benefit; or parasitic, in which the interaction harms one species and benefits the other.
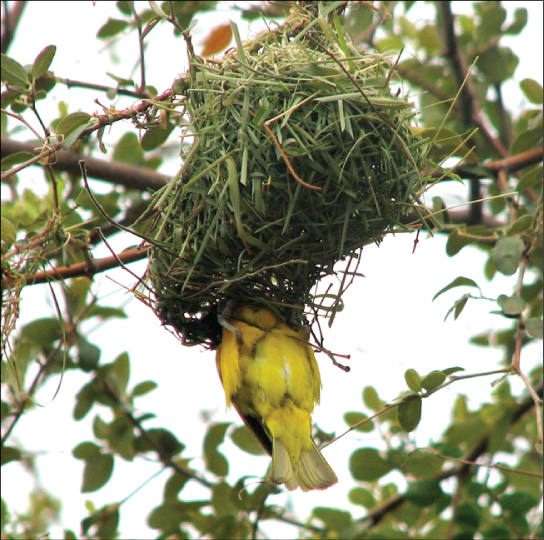
Commensalism occurs when one species benefits from a close prolonged interaction, while the other neither benefits or is harmed. Birds nesting in trees provide an example of a commensal relationship (Figure 8). The tree is not harmed by the presence of the nest among its branches. The nests are light and produce little strain on the structural integrity of the branch, and most of the leaves, which the tree uses to get energy by photosynthesis, are above the nest so they are unaffected. The bird, on the other hand, benefits greatly. If the bird had to nest in the open, its eggs and young would be vulnerable to predators. Many potential commensal relationships are difficult to identify because it is difficult to prove that one partner does not derive some benefit from the presence of the other.
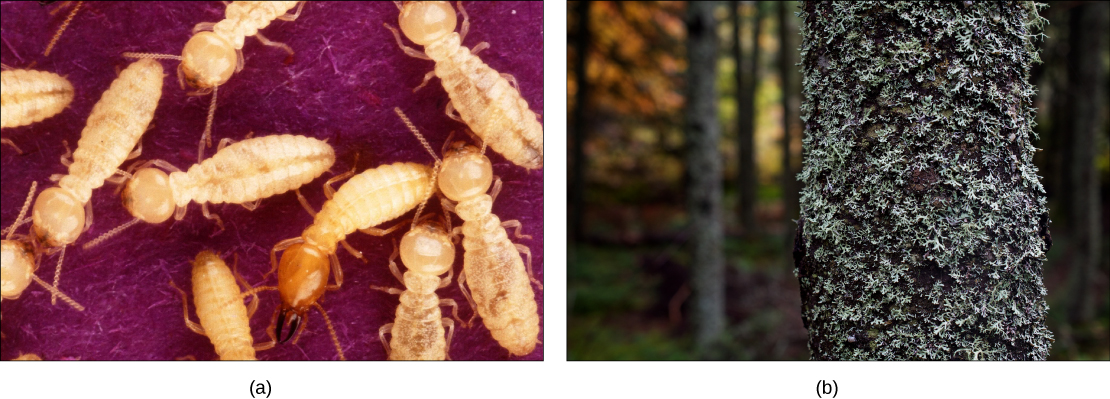
A second type of symbiotic relationship is called mutualism, in which two species benefit from their interaction. For example, termites have a mutualistic relationship with protists that live in the insect’s gut (Figure 9a). The termite benefits from the ability of the protists to digest cellulose. However, the protists are able to digest cellulose only because of the presence of symbiotic bacteria within their cells that produce the cellulase enzyme. The termite itself cannot do this; without the protozoa, it would not be able to obtain energy from its food (cellulose from the wood it chews and eats). The protozoa benefit by having a protective environment and a constant supply of food from the wood chewing actions of the termite. In turn, the protists benefit from the enzymes provided by their bacterial endosymbionts, while the bacteria benefit from a doubly protective environment and a constant source of nutrients from two hosts. Lichen are a mutualistic relationship between a fungus and photosynthetic algae or cyanobacteria (Figure 9b). The glucose produced by the algae provides nourishment for both organisms, whereas the physical structure of the lichen protects the algae from the elements and makes certain nutrients in the atmosphere more available to the algae. The algae of lichens can live independently given the right environment, but many of the fungal partners are unable to live on their own.
A parasite is an organism that feeds off another without immediately killing the organism it is feeding on. In parasitism,the parasite benefits, but the organism being fed upon, the host, is harmed. The host is usually weakened by the parasite as it siphons resources the host would normally use to maintain itself. Parasites may kill their hosts, but there is usually selection to slow down this process to allow the parasite time to complete its reproductive cycle before it or its offspring are able to spread to another host. Parasitism is a form of predation.

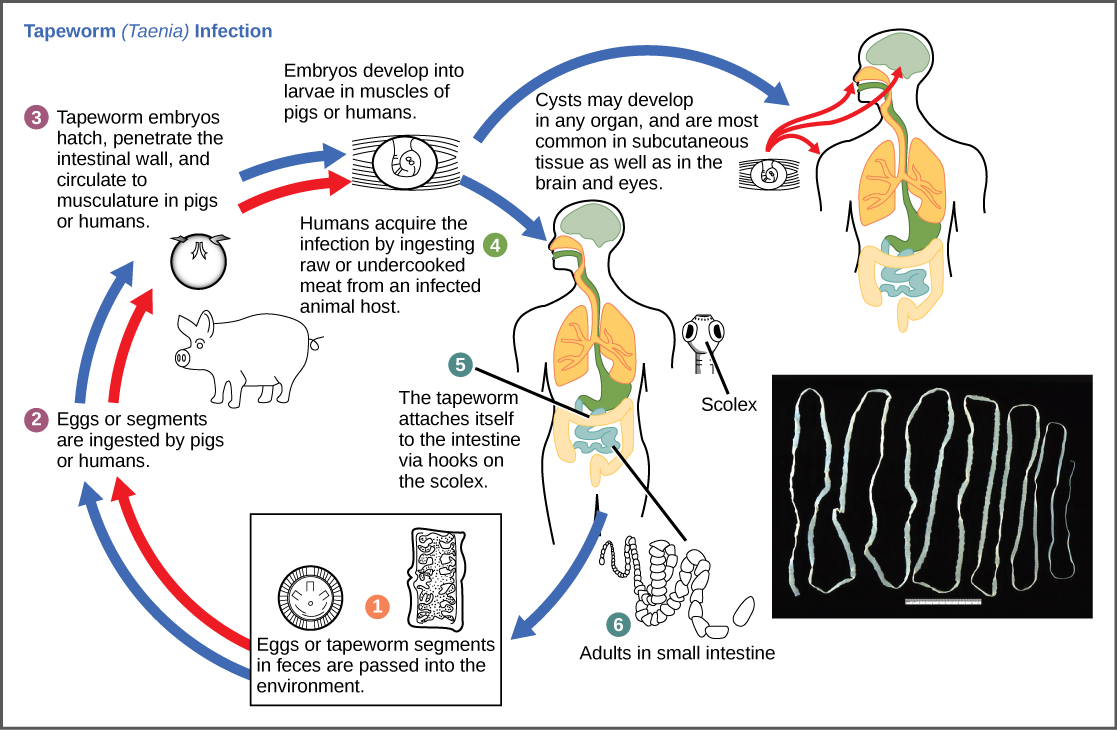
The reproductive cycles of parasites are often very complex, sometimes requiring more than one host species. A tapeworm causes disease in humans when contaminated and under-cooked meat such as pork, fish, or beef is consumed (Figure 10). The tapeworm can live inside the intestine of the host for several years, benefiting from the host’s food, and it may grow to be over 50 feet long by adding segments. The parasite moves from one host species to a second host species in order to complete its life cycle.
Characteristics of Communities
Communities are complex systems that can be characterized by their structure (the number and size of populations and their interactions) and dynamics (how the members and their interactions change over time). Understanding community structure and dynamics allows us to minimize impacts on ecosystems and manage ecological communities we benefit from.
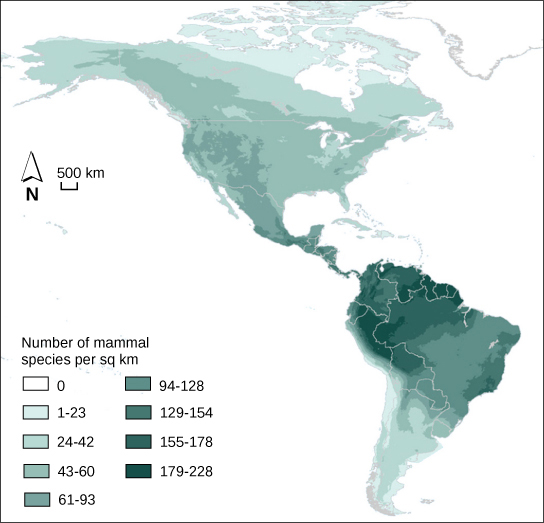
Ecologists have extensively studied one of the fundamental characteristics of communities: biodiversity. One measure of biodiversity used by ecologists is the number of different species in a particular area and their relative abundance. The area in question could be a habitat, a biome, or the entire biosphere. Species richness is the term used to describe the number of species living in a habitat or other unit. Species richness varies across the globe (Figure 11). Species richness is related to latitude: the greatest species richness occurs near the equator and the lowest richness occurs near the poles. The exact reasons for this are not clearly understood. Other factors besides latitude influence species richness as well. For example, ecologists studying islands found that biodiversity varies with island size and distance from the mainland.
Relative abundance is the number individuals in a species relative to the total number of individuals in all species within a system. Foundation species, described below, often have the highest relative abundance of species.
Foundation species are considered the “base” or “bedrock” of a community, having the greatest influence on its overall structure. They are often primary producers, and they are typically an abundant organism. For example, kelp, a species of brown algae, is a foundation species that forms the basis of the kelp forests off the coast of California.
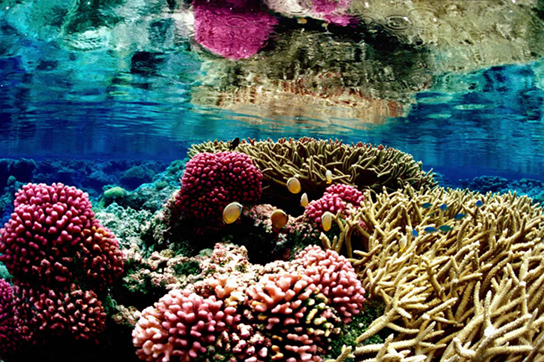
Foundation species may physically modify the environment to produce and maintain habitats that benefit the other organisms that use them. Examples include the kelp described above or tree species found in a forest. The photosynthetic corals of the coral reef also provide structure by physically modifying the environment (Figure 12). The exoskeletons of living and dead coral make up most of the reef structure, which protects many other species from waves and ocean currents.
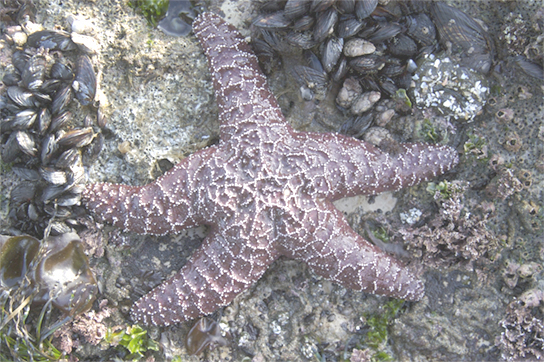
A keystone species is one whose presence has inordinate influence in maintaining the prevalence of various species in an ecosystem, the ecological community’s structure, and sometimes its biodiversity. Pisaster ochraceus, the intertidal sea star, is a keystone species in the northwestern portion of the United States (Figure 13). Studies have shown that when this organism is removed from communities, mussel populations (their natural prey) increase, which completely alters the species composition and reduces biodiversity. Another keystone species is the banded tetra, a fish in tropical streams, which supplies nearly all of the phosphorus, a necessary inorganic nutrient, to the rest of the community. The banded tetra feeds largely on insects from the terrestrial ecosystem and then excretes phosphorus into the aquatic ecosystem. The relationships between populations in the community, and possibly the biodiversity, would change dramatically if these fish were to become extinct.
BIOLOGY IN ACTION
Invasive species are non-native organisms that, when introduced to an area out of its native range, alter the community they invade. In the United States, invasive species like the purple loosestrife (Lythrum salicaria) and the zebra mussel (Dreissena polymorpha) have drastically altered the ecosystems they invaded. Some well-known invasive animals include the emerald ash borer (Agrilus planipennis) and the European starling (Sturnus vulgaris). Whether enjoying a forest hike, taking a summer boat trip, or simply walking down an urban street, you have likely encountered an invasive species.
One of the many recent proliferations of an invasive species concerns the Asian carp in the United States. Asian carp were introduced to the United States in the 1970s by fisheries (commercial catfish ponds) and by sewage treatment facilities that used the fish’s excellent filter feeding abilities to clean their ponds of excess plankton. Some of the fish escaped, and by the 1980s they had colonized many waterways of the Mississippi River basin, including the Illinois and Missouri Rivers.
Voracious feeders and rapid reproducers, Asian carp may outcompete native species for food and could lead to their extinction. One species, the grass carp, feeds on phytoplankton and aquatic plants. It competes with native species for these resources and alters nursery habitats for other fish by removing aquatic plants. In some parts of the Illinois River, Asian carp constitute 95 percent of the community’s biomass. Although edible, the fish is bony and not desired in the United States.
The Great Lakes and their prized salmon and lake trout fisheries are being threatened by Asian carp. The carp are not yet present in the Great Lakes, and attempts are being made to prevent its access to the lakes through the Chicago Ship and Sanitary Canal, which is the only connection between the Mississippi River and Great Lakes basins. To prevent the Asian carp from leaving the canal, a series of electric barriers have been used to discourage their migration; however, the threat is significant enough that several states and Canada have sued to have the Chicago channel permanently cut off from Lake Michigan. Local and national politicians have weighed in on how to solve the problem. In general, governments have been ineffective in preventing or slowing the introduction of invasive species.
Community Dynamics
Community dynamics are the changes in community structure and composition over time, often following environmental disturbances such as volcanoes, earthquakes, storms, fires, and climate change. Communities with a relatively constant number of species are said to be at equilibrium. The equilibrium is dynamic with species identities and relationships changing over time, but maintaining relatively constant numbers. Following a disturbance, the community may or may not return to the equilibrium state.
Succession describes the sequential appearance and disappearance of species in a community over time after a severe disturbance. In primary succession, newly exposed or newly formed rock is colonized by living organisms. In secondary succession, a part of an ecosystem is disturbed and remnants of the previous community remain. In both cases, there is a sequential change in species until a more or less permanent community develops.
Primary Succession and Pioneer Species
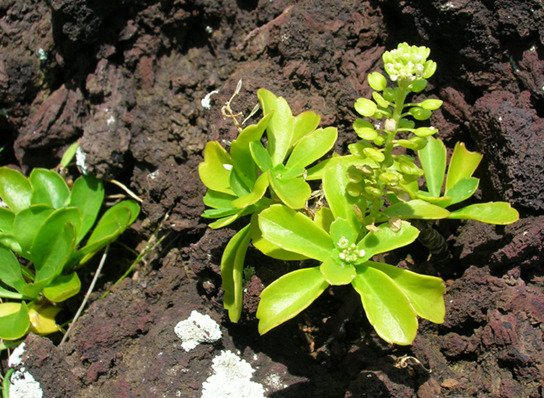
Primary succession occurs when new land is formed, or when the soil and all life is removed from pre-existing land. An example of the former is the eruption of volcanoes on the Big Island of Hawaii, which results in lava that flows into the ocean and continually forms new land. From this process, approximately 32 acres of land are added to the Big Island each year. An example of pre-existing soil being removed is through the activity of glaciers. The massive weight of the glacier scours the landscape down to the bedrock as the glacier moves. This removes any original soil and leaves exposed rock once the glacier melts and retreats.
In both cases, the ecosystem starts with bare rock that is devoid of life. New soil is slowly formed as weathering and other natural forces break down the rock and lead to the establishment of hearty organisms, such as lichens and some plants, which are collectively known as pioneer species (Figure 14) because they are the first to appear. These species help to further break down the mineral-rich rock into soil where other, less hardy but more competitive species, such as grasses, shrubs, and trees, will grow and eventually replace the pioneer species. Over time the area will reach an equilibrium state, with a set of organisms quite different from the pioneer species.
Secondary succession
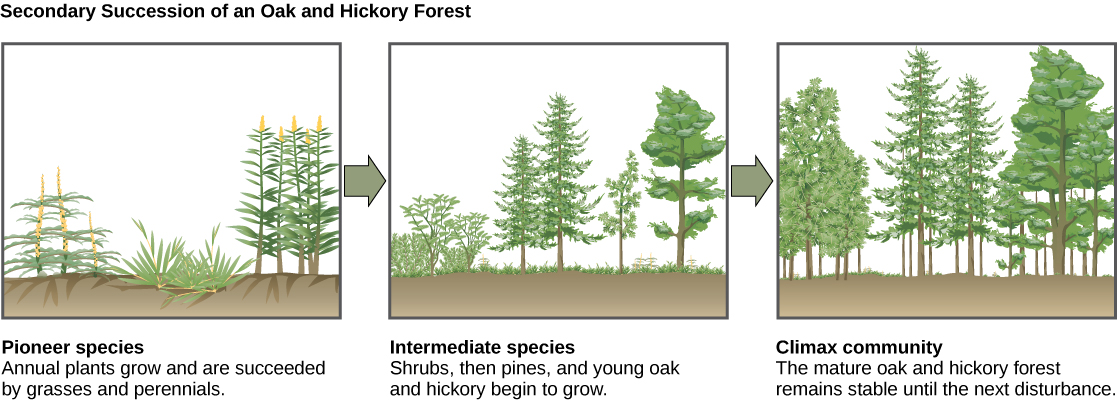
A classic example of secondary succession occurs in forests cleared by wildfire, or by clearcut logging (Figure 15). Wildfires will burn most vegetation, and unless the animals can flee the area, they are killed. Their nutrients, however, are returned to the ground in the form of ash. Thus, although the community has been dramatically altered, there is a soil ecosystem present that provides a foundation for rapid recolonization.
Before the fire, the vegetation was dominated by tall trees with access to the major plant energy resource: sunlight. Their height gave them access to sunlight while also shading the ground and other low-lying species. After the fire, though, these trees are no longer dominant. Thus, the first plants to grow back are usually annual plants followed within a few years by quickly growing and spreading grasses and other pioneer species. Due, at least in part, to changes in the environment brought on by the growth of grasses and forbs, over many years, shrubs emerge along with small trees. These organisms are called intermediate species. Eventually, over 150 years or more, the forest will reach its equilibrium point and resemble the community before the fire. This equilibrium state is referred to as the climax community, which will remain until the next disturbance. The climax community is typically characteristic of a given climate and geology. Although the community in equilibrium looks the same once it is attained, the equilibrium is a dynamic one with constant changes in abundance and sometimes species identities.
Attribution
Community Ecology by OpenStax is licensed under CC BY 4.0. Modified from the original by Matthew R. Fisher.

