
Consequences of Climate Change
In this section, we will discuss the effects of climate change, both those that have already been observed, as well as future predictions based on scientific climate models (see the previous section for a discussion of scientific models). Here, the differences between the terms global warming and climate change become apparent. Global warming refers to the increase in the average temperature of the Earth’s atmosphere due to elevated greenhouse gas concentrations, heightening the greenhouse effect. We have already observed this increase occurring, as you saw in Figure 7.12 from the previous section. We have also seen, and expect to continue to see, other changes occurring in the climate of the Earth. Furthermore, changes have been observed, and we expect to continue to observe, changes in other chemical, physical, and biological aspects of the Earth’s environment. We will only discuss some of the consequences of climate change in this section, including changes in temperature, precipitation, ocean level, and ocean acidity. Many more changes have been seen, and are projected to continue in the future. These include: changes in the amount and distribution of ice and snow, changes in seasonality, ecosystem shift, and habitat changes of plant and animal populations, in addition to others. For more information about these consequences of climate change, visit this site: EPA – Climate Change Impacts
Temperature and precipitation
Temperature and precipitation are the two most direct impacts on the Earth’s climate due to climate change. By now, you should already understand why an increase in greenhouse gas levels in the atmosphere causes an increase in temperature. But why does it also impact precipitation patterns? As you already know, water vapor is an important component of the Earth’s atmosphere (see Chapter 6). As the air in the troposphere warms and cools, the amount of water vapor that it holds changes dramatically. Here in Georgia, we have very hot and humid summers. The high summer humidity in this region is possible due to the increased capability warm air has to hold water vapor. Simply put, warmer air can hold more water than cooler air. As the air cools, its ability to hold water vapor decreases, and any excess water will leave the air as liquid water. A great example of this is the formation of dew on surfaces overnight. During the day, the temperature is warmer than it is at night, and the air has a relatively high holding capacity for water vapor. When the sun sets, the air cools, decreasing its capacity to hold water vapor. That extra water must go somewhere, and it does that by accumulating on surfaces. Similarly, when warm and cool air fronts collide, the chances for rain and thunderstorms increase. Furthermore, an increase in temperature enhances evaporation occurring at the Earth’s surface. This increased evaporation leads to greater concentrations of water vapor in the atmosphere which can lead to increased precipitation.
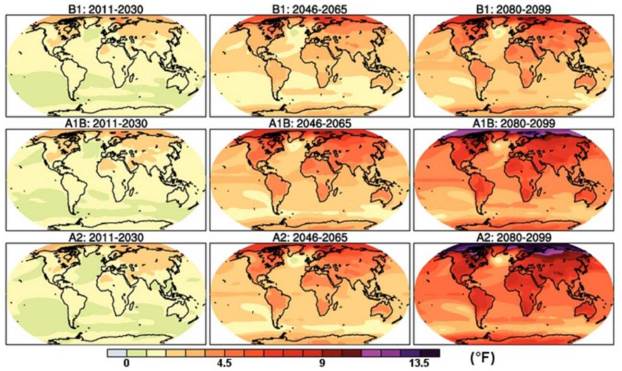
The temperature change that we have already seen in the Earth’s average atmospheric temperature is relatively small (about 0.6 °C, according to Figure 7.12 from Section 7.2). However, as with many of the aspects of climate change, the potential for greater changes increases dramatically as time progresses in the future. This can be seen in Figure 7.13, which displays a model of the predicted temperature increase. Notice that these changes occur relatively rapidly, and are not uniform across the globe. What might be some of the reasons for this?
Changes in precipitation occur due to a variety of factors, including changes in atmospheric water vapor content due to changing temperature, as discussed above. Also at play is the heightened evaporation rate of water on Earth’s surface under warmer temperatures. More evaporation leads to more precipitation. Finally, shifts in wind patterns impact the distribution of precipitation events. As you can see in Figure 7.14, some areas of the globe are expected to have an increase in precipitation, while others are expected to have a dramatic decrease. Some major population centers projected to have a moderate to severe precipitation increase include (population estimates of the metropolitan area given in parentheses): New York, United States (20.1 million); Bogota, Colombia (12.1 m.); and Manila, Philippines (11.9 m.). What sort of challenges might these cities face in the future as they deal with this change in their climate?
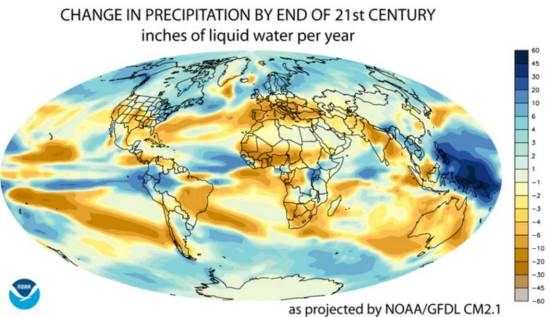
In contrast, many more major metropolitan areas are projected to have a moderate to severe precipitation decrease (droughts) by the end of the 21st century. These include Delhi, India (21.8 m.); Lagos, Nigeria (21 m.); Sao Paulo, Brazil (20.9 m.); Kolkata, India (14.6 m.); Istanbul, Turkey (14.4 m.); Los Angeles, United States (13.3 m.); Rio de Janeiro, Brazil (12 m.); Paris, France (12 m.); and Lahore, Pakistan (11.3 m.). The largest challenge that these areas are likely to face is a dwindling water supply for drinking and agriculture. See Chapter 8 for more detail on the challenges faced by societies to supply clean, reliable water to their populations and farms.
Additional challenges may be felt by all areas of the world concerning changes in the seasonality or timing of precipitation, as well as the form in which precipitation falls (e.g., mist or downpour; rain, ice, or snow). All of these factors affect the availability of soil water for plants, the flow of rivers and streams, and the overall accessibility of water worldwide. Furthermore, scientists predict an increase in the number and severity of storms as climate change progresses. For a full discussion of the potential impacts of this, see the assigned article.
Sea level rise
While we know that water continuously cycles around the world (see Chapter 8 for information on the water cycle) and that the overall quantity of water on Earth will not change due to global climate change, the distribution of this water is changing. In particular, oceans are increasing in volume while land ice stores (such as glaciers) are decreasing. This contributes to an increase in sea level worldwide (Figure 7.15).
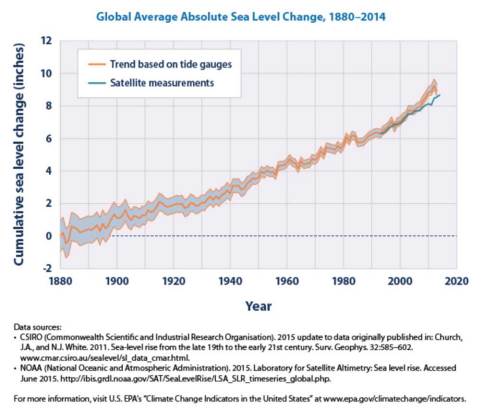
From the data in Figure 7.15, we see that sea level has increased at an average of 0.06 inches (0.15 cm) per year over the period shown above. Most of this rise, however, has occurred within the most recent decades. The rate of increase has gone up to between 0.11 to 0.14 inches
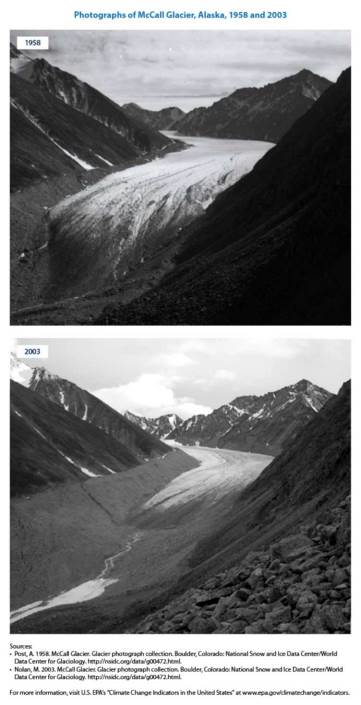
(0.28 to 0.36 cm) per year since 1993. There are two forces causing sea level to rise, both caused by climate change. First, the increased global temperature has caused increased ice melting in many regions of the globe. Melting land ice (such as the glacier shown in Figure 7.16) contributes to sea level rise because water that used to be stored in ice sitting on top of land becomes running water which reaches the ocean through runoff. We also observe sea ice melting (see EPA – Climate Change Indicators for data and figures). Sea ice, such as the ice that covers the arctic regions of the Northern Hemisphere, has no land underneath it. When it melts, the water stays in the same locations, and the overall sea level does not change.
The second factor that influences sea level rise is a phenomenon called thermal expansion. Due to the physical properties of water, as water warms, its density decreases. A less dense substance will have fewer molecules in a given area than a more dense substance (see Chapter 1 supplemental material). This means that as the overall temperature of the oceans increases due to global climate change, the same amount of water molecules will now occupy a slightly larger volume. This may not seem significant, but considering the 1.3 billion trillion liters (264 billion gallons) of water in the ocean, even a small change in density can have large effects on sea level as a whole.
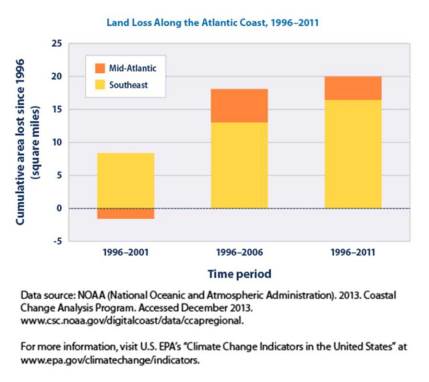
Scientists have already documented sea level rise in some areas of the world, including one familiar to most of us: the Southeastern United States. Figure 7.17 depicts the measured land area lost due to increasing sea level since 1996. Note that the Southeast (defined here as the Atlantic coast of North Carolina south to Florida) is particularly susceptible to land area loss due to the gently sloping nature of our coastline. Moving northward into the Mid-Atlantic States (defined here as Virginia north to Long Island, New York), coastal habitats tend to have a steeper geography, which protects against some losses.
While the ecological effects of sea level rise remain in the United States, we don’t project any catastrophic loss of life, property, or livelihood for some time. This is, in part, due to large investments that we have made in infrastructure to protect our cities and farmlands. This is not the case in many areas of the world. For a discussion of the impacts of sea level rise on less-industrialized nations of Bangladesh, Maldives, Kiribati, and Fiji, review the required article reading.
Ocean acidification
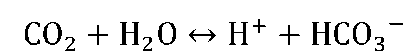
Dissolved CO2 is essential for many organisms, including shell-building animals and other organisms that form a hard coating on their exterior (e.g., shellfish, corals, and Haptophyte algae). This hard coating is built out of aragonite, a mineral form of the molecule calcium carbonate, CaCO3. These organisms rely on the formation of carbonate ions (see Chapter 1 supplemental material for information on ions), CO32-, from dissolved CO2, through a natural, chemical reaction that occurs. This takes place through a chain-reaction equation, where bicarbonate (HCO3–) is formed as an intermediate, and hydrogen ions (H+) are generated (equations 7.3 and
7.4).
Eq. 7.3
Eq. 7.4
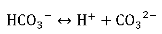
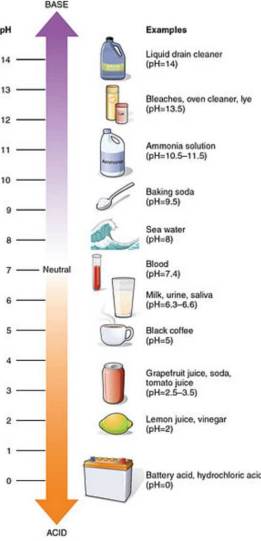
As you can see, both equations 7.3 and 7.4 each produce one H+. This is significant to water chemistry because an increase in H+ concentration means a decrease in the pH of the water. You can see in Figure 7.18 that a lower pH means that the liquid is more acidic. As shown in the interactive graphic, an increase in CO2 in the atmosphere causes additional CO2 to be dissolved in the ocean. This means that more CO2 in the atmosphere leads to more acidic ocean environments.
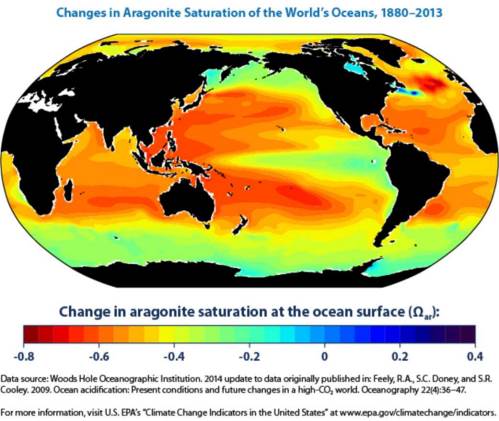
Unfortunately for shell-building animals, the buildup of H+ in the more acidic ocean environment blocks the absorption of calcium and CO32-, and makes the formation of aragonite more difficult. An aragonite deficit is already being documented in many of the world’s oceans, as shown in Figure 7.19. To have a better visualization of this process, follow along with this interactive graphic at: https://www.whoi.edu/multimedia/carbon-dioxide-shell-building-and-ocean-acidification/
The increasing acidity of the world’s oceans is resulting in habitat changes across the globe. This is only expected to worsen as atmospheric CO2 levels continue to increase. Many organisms, including the corals that are the foundation species of the beautiful coral reefs, are very sensitive to changes in ocean pH. Scientists have documented cases of ecosystem destruction through coral bleaching, caused by the effects of climate change including ocean acidification and increased temperature. For more information, visit the NOAA Coral Reef Conservation Program website: https://coralreef.noaa.gov/about/welcome.html
Looking Forward: Climate Solutions
While the situation surrounding global climate change is in serious need of our attention, it is important to realize that many scientists, leaders, and concerned citizens are making solutions to climate change part of their life’s work. The two solutions to the problems caused by climate change are mitigation and adaptation, and we will likely need a combination of both to prosper in the future.
Adaptation strategies
We know that climate change is already occurring, as we can see and feel the effects of it. For this reason, it is essential to also adapt to our changing environment. This means that we must change our behaviors in response to the changing environment around us. Some adaptation strategies are discussed in the required article reading.
Adaption strategies will vary greatly by region, depending on the largest specific impacts in that area. For example, in the city of Delhi, India, a dramatic decrease in rainfall is projected over the next century (Figure 7.14). This city will likely need to implement policies and practices relating to the conservation of water, for example: rainwater harvesting, water reuse, and increased irrigation efficiency. Rain-limited cities near oceans, such as Los Angeles, California may choose to use desalination to provide drinking water to their citizens. Desalination involves taking the salt out of seawater to make it potable (Chapter 8).
Cities with low elevations near oceans may need to implement adaptation strategies to rising sea levels, from seawalls and levees to relocation of citizens. One adaptation strategy gaining use is the creation or conservation of wetlands, which provide natural protection against storm surges and flooding.
Mitigation strategies
In general, a strategy to mitigate climate change reduces the amount of greenhouse gases in the atmosphere or prevents additional emissions. Mitigation strategies attempt to “fix” the problems caused by climate change. Governmental regulations regarding the fuel efficiency of vehicles are one example of an institutionalized mitigation strategy already in place in the United States and many other countries around the world. Unlike some other countries, there are no carbon taxes or charges for burning fossil fuels in the United States. This is another governmental mitigation strategy that is effective in many countries including India, Japan, France, Costa Rica, Canada, and the United Kingdom.
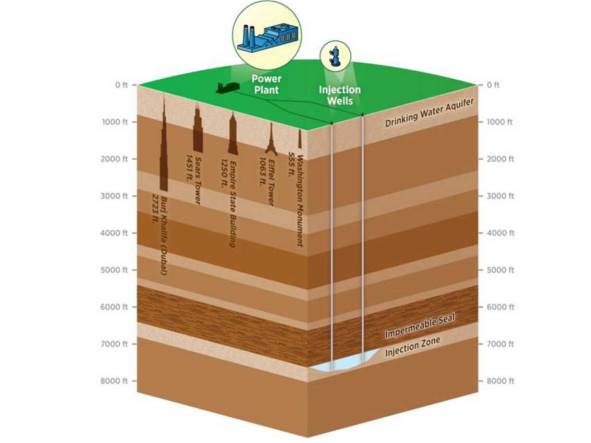
In addition to government measures and incentives, technology can also be harnessed to mitigate climate change. One strategy for this is the use of carbon capture and sequestration (CCS). Through CCS, 80-90% of the CO2 that would have been emitted to the atmosphere from sources such as a coal-fired power plant is captured and then stored deep beneath the Earth’s surface. The CO2 is often injected and sequestered hundreds of miles underground into porous rock formations sealed below an impermeable layer, where it is stored permanently (Figure 7.20).
Scientists are also looking into the use of soils and vegetation for carbon storage potential. Proper management of soil and forest ecosystems has been shown to create additional carbon sinks for atmospheric carbon, reducing the overall atmospheric CO2 burden. Increasing soil carbon further benefits communities by providing better-quality soil for agriculture and cultivation.
Technologies related to alternative energy sources (Chapter 5) mitigate climate change by providing people with energy not derived from the combustion of fossil fuels. Finally, simple activities such as energy conservation, choosing to walk or bike instead of driving, and disposing of waste properly are activities that, when done by large numbers of people, actively mitigate climate change by preventing carbon emissions.
Take a moment to identify ways that you can be involved in the mitigation of or adaptation to climate change. What changes can you make in your own life to prevent excess carbon emissions? Similar to your ecological footprint, which you should have already calculated in the lab, you can also calculate your carbon footprint. Use the EPA’s carbon footprint calculator to do so, and investigate the Reduce Your Emissions section to find ways to decrease your carbon footprint.
Resources
Belt, Don. “The Coming Storm.” National Geographic Magazine, May 2011. http://ngm.nationalgeographic.com/print/2011/05/bangladesh/belt-text
IPCC Fourth Assessment Report: Climate Change 2007 Synthesis Report. 4. Adaptation and mitigation options https://www.ipcc.ch/publications_and_data/ar4/syr/en/spms4.html
IPCC AR6 Synthesis Report: Climate Change 2023
NOAA Coral Reef Conservation Program: Climate Change http://coralreef.noaa.gov/threats/climate/
NOAA Geophysical Fluid Dynamics Laboratory: Will the wet get wetter and the dry drier?
Ontl, Todd and Lisa Schulte (2012) Soil Carbon Storage. Nature Education Knowledge 3(10):35 http://www.nature.com/scitable/knowledge/library/soil-carbon-storage-84223790
US EPA Carbon Dioxide Capture and Sequestration
US EPA Carbon Footprint Calculator http://www3.epa.gov/carbon-footprint-calculator/
US EPA Climate Change Indicators in the United States
Terms list:
Acidity
Adaptation
Aragonite
Bicarbonate
Calcium carbonate
Carbon capture and sequestration
Carbon footprint
Carbon tax
Carbonate
Climate Climate change Coral bleaching Desalination Evaporation Glacier
Global warming Hydrogen ions Land ice Mitigation
pH
Precipitation
Runoff
Sea ice
Thermal expansion
Wetland
—————————————————-
Attribution
Zehnder, Caralyn; Manoylov, Kalina; Mutiti, Samuel; Mutiti, Christine; VandeVoort, Allison; and Bennett, Donna, “Introduction to Environmental Science: 2nd Edition” (2018). Biological Sciences Open Textbooks. 4.
https://oer.galileo.usg.edu/biology-textbooks/4
This work is licensed under a Creative Commons Attribution-Noncommercial-Share Alike 4.0 License.
