
The Science of Climate Change
What is causing global climate change?
Scientists have identified the source of our current global climate change as being the increased human-caused emissions of greenhouse gases such as carbon dioxide (CO2), methane (CH4), and nitrous oxide (N2O), since the industrial revolution. Greenhouse gases are defined as large (at least three atoms) gas molecules that participate in the greenhouse effect. While you already know about the “big three” greenhouse gases (CO2, CH4, and N2O), it’s important to realize that water vapor (H2O) is also a greenhouse gas. While humans have little direct impact on water vapor concentrations in the atmosphere, is it still an essential component of the natural greenhouse effect that occurs in our atmosphere.
The Greenhouse Effect
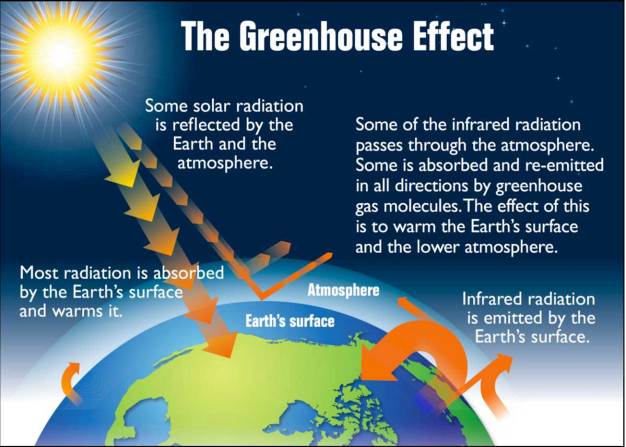
The Earth receives energy from the sun and in turn, radiates energy back into space. When these two energies are equal, a stable temperature of the Earth is achieved. This temperature can be calculated from basic physics and is equal to about -18°C (-1°F). This thermal equilibrium temperature is much colder than that of the surface of the Earth. The actual average value of the Earth’s surface temperature is about 15°C (59°F). The difference between these temperatures is primarily due to the natural greenhouse gas concentrations in the atmosphere that cause the greenhouse effect. If the Earth had no naturally occurring atmospheric greenhouse gases, the temperature at the surface of the Earth would equal the thermal equilibrium temperature. The influence of these greenhouse gases, mainly water and some CO2, moderates the Earth’s climate and makes life possible (Figure 7.6).
As solar radiation reaches the Earth’s atmosphere, there are a variety of possibilities for its fate. Some solar radiation is reflected by the Earth and its atmosphere and does not contribute to warming. Some pass through the atmosphere and reach the surface of the Earth. When this solar radiation is absorbed by objects on Earth’s surface, it is re-emitted as infrared radiation (heat) that escapes to space. However, some of this heat is intercepted in the atmosphere by greenhouse gases. These gases absorb and re-emit the radiation in all directions. This creates a warming impact on the Earth’s surface and radiation can be bounced around from one greenhouse gas molecule to another, becoming trapped, and increasing its warming potential. For this reason, an increased greenhouse gas concentration causes an increase in the overall warming potential of the Earth’s atmosphere.
Studying Climate Change
Ice Cores and Stable Isotopes
On a geological time scale, the climate has changed many times in the past, even before the presence of humans. These changes occurred naturally because man had not yet evolved. A well-known example of past climate change is the occurrence of ice ages. Ice ages have occurred repeatedly throughout Earth’s history, the most severe ice age of which scientists have reliable data occurred around 650,000 years ago. During this time, solid, glacial ice covered much of Canada, the northern United States, and northern Europe; the level of the ocean decreased by 120 m, and the global average temperature decreased by 5°C.
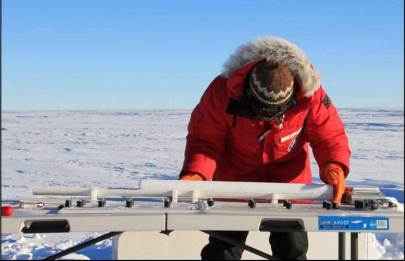
A geologic history of ice events is preserved in the ice sheets covering Antarctica and Greenland. This history has been uncovered over the past decades by scientists who have cored deeply into the ice and deciphered the temperature and atmospheric composition records stored in the ice. This process of obtaining ice cores is shown in Figure 7.7. The temperature at which the ice originally formed can be obtained from an interpretation of the measured ratio of the stable isotopes (see Chapter 1 supplement for a description of isotopes) of oxygen in the molecules of water forming the ice. The atmospheric gas composition is taken from air bubbles trapped in the ice at the time of formation.
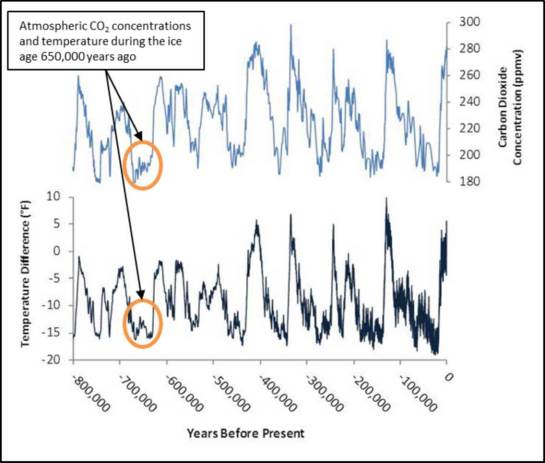
From this data, scientists have gathered a set of reliable data that track atmospheric temperature and gas concentrations that date back 800,000 years. This data helped scientists conclude that the Earth’s temperature and greenhouse gas concentrations are directly correlated with one another (Figure 7.8). During the ice age 650,000 years ago, the Earth was experiencing depressed temperatures and atmospheric CO2 concentrations below 200 parts per million (ppm). We can also see from this data, that CO2 concentrations can be naturally elevated to as high as 300 ppm, correlating with increased temperatures.
Milankovitch cycles
The 100,000-year major cycle of the ice ages and some variations within the cycles agree very well with predicted periodic relationships between the Earth’s orbit around the sun, generally referred to as the Milankovitch cycles. Milankovitch cycles describe the very slight “wobbles” that occur in the Earth’s tilt and path as it moves around the sun. The Earth is always slightly tilted on its axis with respect to the sun. The angle of this tilt, however, changes periodically, varying from about 22° to about 25°. A less severe tilt will cause milder summers and winters close to the poles, preventing full summer ice melt in the northern- and southernmost regions, and allowing for a buildup of ice from year to year.
The path through which the Earth travels on its journey around the sun also changes from a more circular to a more elongated shape. Again, a round orbit will cause milder summers and winters close to the poles. These are very long-term changes, and the results of the Milankovitch cycles can be observed in the changes in temperature and atmospheric CO2 concentration shown in Figure 7.8. The climate change event that scientists are currently documenting is occurring much more rapidly than could be explained by Milankovitch cycles. Therefore, scientists agree that the cause of our currently changing climate is due to human impacts and not natural forces.
Greenhouse gases
We will be covering the four major categories of greenhouse gases that have been impacted by humans the most. See Table 7.2 for a numeric comparison of these greenhouse gases.
- Carbon dioxide, CO2
- Methane, CH4
- Nitrous oxide, N2O
- Synthetic fluorinated gases, including hydrofluorocarbons (HFCs), perfluorocarbons (PFCs), and sulfur hexafluoride (SF6)
Carbon Dioxide
Carbon dioxide (CO2) is the greenhouse gas responsible for most of the human-caused climate change in our atmosphere. It has the highest concentration in the atmosphere of any of the greenhouse gases that we’ll discuss here. Remember that CO2 is a direct product of both combustion and cellular respiration, meaning it is produced in great quantities both naturally and anthropogenically. Any time biomass or fossil fuels are burned, CO2 is released. Major anthropogenic sources include electricity production from coal-fired and natural gas power plants, transportation, and industry (Chapter 4). To get an idea of how CO2 concentration has changed over time, watch this video compiled by the National Oceanic and Atmospheric Administration (NOAA):
http://www.esrl.noaa.gov/gmd/ccgg/trends/history.html.
This video contains atmospheric CO2 concentrations measured directly, dating back to 1958, as well as atmospheric CO2 concentrations measured indirectly from ice core data, dating back to 800,000 BCE. By 1990, a quantity of over seven billion tons of carbon (equivalent to 26 billion tons of carbon dioxide when the weight of the oxygen atoms is also considered) was being emitted into the atmosphere every year, much of it from industrialized nations. Similar to the action of the naturally existing greenhouse gases, any additional greenhouse gases lead to an increase in the surface temperature of the Earth.
Methane and Nitrogen Dioxide
While CO2 is produced by aerobic cellular respiration, gases such as CH4 and N2O are often the products of anaerobic metabolisms. Agriculture is a major contributor to CH4 emissions, as you saw in section 7.1. In addition to anaerobic bacteria, methane is also a significant component of natural gas and is commonly emitted through the mining and use of natural gas and petroleum, in addition to coal mining. For a review of how fossil fuels are mined, see Chapter 4. Finally, landfills contribute significantly to CH4 emissions, as the waste put into the landfill largely undergoes anaerobic decomposition as it is buried under many layers of trash and soil. Natural sources of CH4 include swamps, wetlands, and volcanoes.
The vast majority of N2O production by humans comes from agricultural land management. While some N2O is naturally emitted to the atmosphere from soil as part of the nitrogen cycle, human changes in land management, largely due to agricultural practices, have greatly increased N2O emissions. Some N2O is also emitted from transportation and industry.
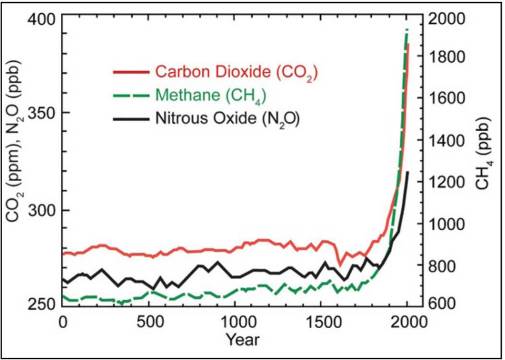
Due to their relatively high concentrations in the atmosphere compared to synthetic gases, CO2, CH4, and N2O, are responsible for most of the human-caused global climate change over the past century. Figure 7.9 shows the increases in all three gases following the Industrial Revolution. Ice core data (Figure 7.8) shows us that the atmospheric CO2 concentration never exceeded 300 ppm before the Industrial Revolution. As of early 2015, the current atmospheric CO2 concentration is 400 ppm. Comparing Figure 7.9 to Figure 7.8, above, what is likely to happen to global temperature following this unprecedented rise in greenhouse gas levels?
Fluorinated Gases
One class of greenhouse gas chemicals that has no natural sources is fluorinated gases. These include HFCs, PFCs, and SF6, among others. Because these are synthetic chemicals that are only created by humans, these gases were essentially nonexistent before the Industrial Revolution. These synthetic gases are used for a wide variety of applications, from refrigerants to semiconductor manufacturing, and propellants to fire retardants. They tend to have a long lifetime in the atmosphere, as seen in Table 7.2. Some of these chemicals, as well as the older chlorofluorocarbons (CFCs), have been phased out by international environmental legislation under the Montreal Protocol (see Chapter 6). Due to their long lifespan, many of these now-banned CFCs remain in the atmosphere. Newer chemical replacements, such as HFCs, provide many of the same industrial applications, but unfortunately have their own environmental consequences.
Just as greenhouse gases differ in their sources and their residence time in the atmosphere, they also differ in their ability to produce the greenhouse effect. This is measured by the global warming potential, or GWP, of each greenhouse gas. The GWP of a greenhouse gas is based on its ability to absorb and scatter energy, as well as its lifetime in the atmosphere. Since CO2 is the most prevalent greenhouse gas, all other greenhouse gases are measured relative to it. As the reference point, CO2 always has a GWP of 1. Note the very high GWP values of the synthetic fluorinated gases in Table 7.2. This is largely due to their very long residence time in the atmosphere. Also, note the higher GWP values for CH4 and N2O compared to CO2.
Table 7.2. Comparison of common greenhouse gases in the atmosphere. Data from US EPA. For more information.
|
Greenhouse gas |
Chemical formula or abbreviation |
Lifetime in atmosphere |
Global warming potential (100-year) |
|
Carbon dioxide |
CO2 |
Variable |
1 |
|
Methane |
CH4 |
12 years |
28-36 |
|
Nitrous oxide |
N2O |
114 years |
298 |
|
Hydrofluorocarbons |
Abbreviation: HFCs |
1-270 years |
12-14,800 |
|
Perfluorocarbons |
Abbreviation: PFCs |
2,600-50,000 years |
7,390 |
|
Sulfur hexafluoride |
SF6 |
3,200 years |
22,800 |
Other Climate Influences
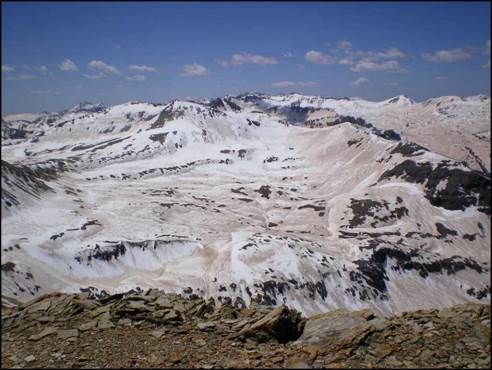
In addition to greenhouse gases, other manmade changes may be forcing climate change. Increases in near-surface ozone from internal combustion engines, aerosols such as carbon black, mineral dust, and aviation-induced exhaust are acting to raise the surface temperature. This primarily occurs due to a decrease in the albedo of light-colored surfaces by the darker-colored carbon black, soot, dust, or particulate matter. As you know, it is more comfortable to wear a white shirt on a hot summer day than a black shirt. Why is this? Because the lighter-colored material bounces more solar radiation back toward space than the darker-colored material does, allowing it to stay cooler. The darker-colored material absorbs more solar radiation, increasing its temperature. Just as the white shirt has a higher albedo than the black shirt, light-colored objects in nature (such as snow) have a higher albedo than dark-colored objects (such as soot or dust). As humans increase the amount of carbon black, soot, dust, and particulates in the atmosphere, we decrease the albedo of light-colored surfaces, causing them to absorb more solar radiation and become warmer than they would without human influence. An example of this can be seen in the snow in Figure 7.10.
Climate Models
Scientists must gather together all data that is available to them to make meaningful conclusions and predictions regarding climate change. When they bring this data together, the prediction they make is in the form of a scientific model. A model is a projection of what might happen in the future based on knowledge of current and past events. The models that are published to predict climate change must pass a rigorous scientific peer-review process and often require the combination of findings from hundreds of experiments. These large-scale models are typically beyond the capacity of a standard desktop computer and must be run by large super-computers housed at research universities or government laboratories.
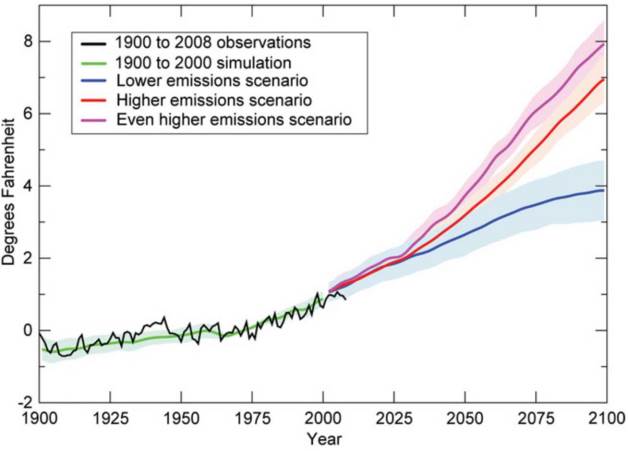
Figure 7.11 is one example of a scientific model of the impacts of climate change. Within this figure, we see the directly measured observations of global average temperature (black line). We also see models of four different scenarios: 1900 to 2000 simulation using actual greenhouse emissions (green line), and 2000 to 2100 simulation using very high (purple line), high (red line), and low (blue line) greenhouse gas emissions scenarios.
Why did scientists make a model of the data from 1900 to 2000 in Figure 7.11 when they could just look up the data in the published literature? This is an important component of model testing. To ensure accuracy of the model, you should not only be able to predict future events but past events as well. Scientists use this as a way to “calibrate” their model. Since this model reliably predicts past events, chances are good that it will reliably predict future events as well.
Another example of a climate model is shown in Figure 7.12, this time comparing climate projections with and without the influences of humans on greenhouse gas emissions. This large model is a combination of the work of many different models, to achieve the most accurate outcome.
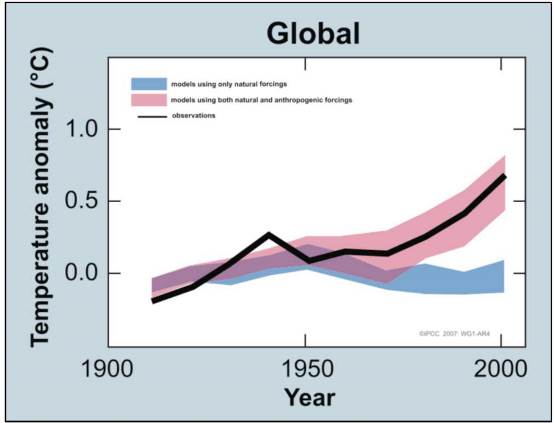
In Figure 7.12, the decadal averages of observations are shown for the period 1906 to 2005 (black line). All temperatures are plotted relative to zero being defined as the corresponding average for the period from 1901 to 1950. The blue shaded band shows the 5% to 95% confidence interval for 19 simulations from 5 climate models using only the natural forcing effects due to solar activity and volcanoes. The red-shaded band shows the 5% to 95% confidence interval for 58 different simulations from 14 climate models using both natural and anthropogenic forces. These different simulations and the different models are used by different scientific groups and represent different treatments of the Earth’s systems. It is thus quite encouraging that model calculations are in major agreement with the assumption that global temperature change from 1900 to 2000 is due to both natural and anthropogenic effects, with anthropogenic effects being the major causes of its recent dramatic increase.
You will see more examples of climate models as you make your way into the final section of the climate change chapter: consequences of climate change.
Resources
NASA Global Climate Change: Vital Signs of the Planet http://climate.nasa.gov/
NOAA Paleoclimatology: Astronomical Theory of Climate Change http://www.ncdc.noaa.gov/paleo/milankovitch.html
Sass, Ronald. Q2: What are the Causes of Global Climate Change? OpenStax CNX. Sep 22, 2009 http://cnx.org/contents/5d263a29-7bd6-47bf-ad70-c233619bca33@3
University of San Diego Virtual Museum: Climate Change http://earthguide.ucsd.edu/virtualmuseum/climatechange2/01_1.shtml
US EPA: Future Climate Change http://www.epa.gov/climatechange/science/future.html
US EPA: Climate Change Impacts
US EPA: Overview of Greenhouse Gases
Terms list
Albedo
Chlorofluorocarbon
Confidence interval
Fluorinated gases
Global warming potential
Greenhouse effect
Hydrofluorocarbon
Ice age
Ice core
Landfill
Milankovitch cycles
Model
Parts per million
Perfluorocarbon
Solar radiation
Stable isotopes
Sulfur hexafluoride
Thermal equilibrium temperature
Water vapor
—————————————————-
Attribution
This section is modified from OpenStax material. Download for free at http://cnx.org/contents/5d263a29-7bd6-47bf–ad70-c233619bca33@3
Zehnder, Caralyn; Manoylov, Kalina; Mutiti, Samuel; Mutiti, Christine; VandeVoort, Allison; and Bennett, Donna, “Introduction to Environmental Science: 2nd Edition” (2018). Biological Sciences Open Textbooks. 4.
https://oer.galileo.usg.edu/biology-textbooks/4
This work is licensed under a Creative Commons Attribution-Noncommercial-Share Alike 4.0 License.
