The Mechanics of Hearing
44 Loudness and Level
Learning Objectives
Be able to describe what physical characteristic of sound predicts perceived loudness.
Know the unit of loudness (decibel) and sound pressure level.
Be able to explain the relationship between perception loudness and stimulus intensity.
The most direct physical correlate of loudness is sound intensity (or sound pressure) measured close to the eardrum. However, many other factors also influence the loudness of a sound, including its frequency content, its duration, and the context in which it is presented. Some of the earliest psychophysical studies of auditory perception, going back more than a century, were aimed at examining the relationships between perceived loudness, the physical sound intensity, and the just-noticeable differences in loudness (Fechner, 1860; Stevens, 1957).
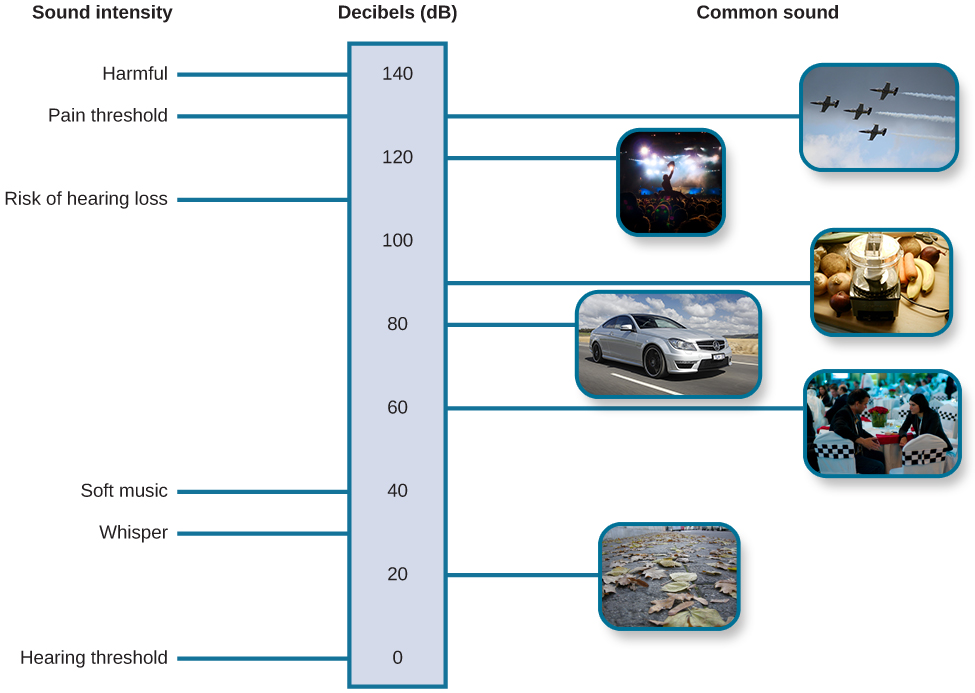
The loudness of a given sound is closely associated with the amplitude of the sound wave. Higher amplitudes are associated with louder sounds. Loudness is measured in terms of decibels (dB), a logarithmic unit of sound intensity. A typical conversation would correlate with 60 dB; a rock concert might check in at 120 dB. A whisper 5 feet away or rustling leaves are at the low end of our hearing range; sounds like a window air conditioner, a normal conversation, and even heavy traffic or a vacuum cleaner are within a tolerable range. However, there is the potential for hearing damage from about 80 dB to 130 dB: These are sounds of a food processor, power lawnmower, heavy truck (25 feet away), subway train (20 feet away), live rock music, and a jackhammer. The threshold for pain is about 130 dB—a jet plane taking off or a revolver firing at close range (Dunkle, 1982).

The decibel (dB) quantifies sound pressure level (SPL). A decibel is a relative measure—a loudness relative to another loudness. Sound pressure level (SPL) is a way to gauge how intense or loud a sound is, and it’s measured in decibels (dB). Essentially, it tells us how strong the vibrations in the air are when we hear a sound. We use SPL to compare different sounds and understand their loudness. The scale starts at 0 dB, which is the quietest sound a human can hear at a certain frequency, typically 1 kHz. As the dB value increases, the sound gets louder. So, SPL gives us a standardized way to talk about the volume of sounds, whether it’s a whisper, a vacuum cleaner, or a rock concert.
To calculate Sound Pressure Level, we use a reference sound intensity of 20 micropascals. It is very useful to remember that an increase in SPL of 20dB represents a 10-fold increase in the amplitude of the pressure wave.
SPL= 20log(P/P₀) =10log(P²/P²₀) = 10log(I/I₀)
Decibels are calculated by the following equation: SPL= 20log(P/P₀). Intensity is the square of the pressure. Intensity is power. So another way of writing the equation above is SPL=10log(P²/P²₀) = 10log(I/I₀). Note: A decibel is 10 bels; a bel is log(I/I₀). A 20Pa (120dB) sound is about 1 Watt of energy.
Perception of loudness vs. stimulus intensity is a compressive function. The use of a logarithmic function (decibels) to characterize sound pressure level makes it a little hard to see. If you plot perceived loudness against dB, you get a function that is essentially linear, maybe even scooping up a bit. However, when you plot perceived loudness against the amplitude of the pressure wave, or even against intensity (pressure squared), you see that our perception of loudness is compressive: the louder a sound is, the bigger the change needs to be before we notice it. The Active Learning Exercise at the end of this chapter lets you do a magnitude estimation experiment to discover your own psychometric function for describing your perception of loudness as a function of sound pressure level (although the speakers on our devices often have some non-linearities, so we’d have to use carefully calibrated equipment to get an exact answer).
CC LICENSED CONTENT, SHARED PREVIOUSLY
NOBA, Hearing
Provided by: University of Minnesota
URL: https://nobaproject.com/modules/hearing
License: CC BY-NC-SA 4.0
OpenStax, Psychology Chapter 5.2 Waves and Wavelengths
Provided by: Rice University.
Download for free at: https://cnx.org/contents/Sr8Ev5Og@12.2:K-DZ-03P@12/5-1-Sensation-versus-Perception.
License: Creative Commons Attribution 4.0
Damon Joyce, Understanding Sound
Provided by: National Parks Service
URL: https://www.nps.gov/subjects/sound/understandingsound.htm
License: Creative Commons Attribution 4.0
Adapted by: Tyrone Trader
CC LICENSED CONTENT, SHARED PREVIOUSLY
Cheryl Olman PSY 3031 Detailed Outline
Provided by: University of Minnesota
Download for free at http://vision.psych.umn.edu/users/caolman/courses/PSY3031/
License of original source: CC Attribution 4.0

