
Basics: neuroscience and psychophysics
3 Psychometric Functions
Psychometric functions describe stimulus/response relationships.
Learning Objectives
Understand why many psychometric functions are S-shaped
Know why maximum performance is rarely 100%
Know why minimum performance can be anything between 0% and 50%
Understand what the slope of a psychometric function indicates
Put together, the concepts from the previous section teach us that perception can be quantified. A graph that shows an observer’s response as a function of the stimulus level or intensity is called a psychometric function. Psychometric functions can have many shapes, but the most common and most interesting is the S-shaped curve that represents an observer’s behavior around a threshold (this works for either absolute or difference thresholds).
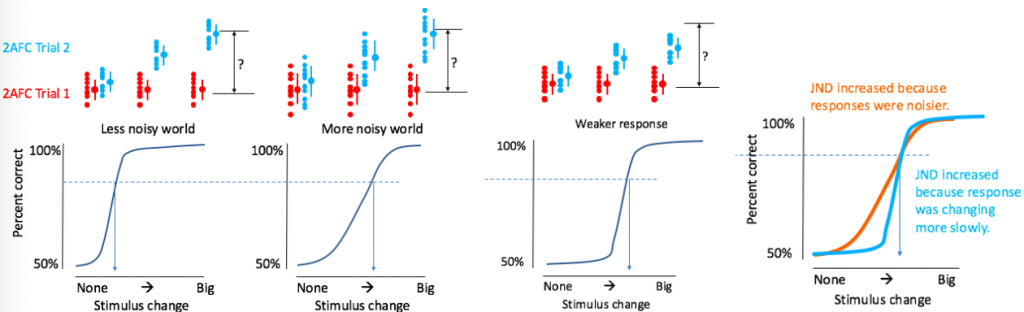
Many psychometric functions are S-shaped because the transition from “can’t tell” to “can tell” is not instantaneous. Because (neural) responses are variable (both bottom-up and top-down effects have variability), observers don’t give the same answer to every stimulus.
- The “ceiling” is the best performance for the most detectable stimuli. Sometimes this is not 100% because people make mistakes in answering (“finger errors”: they hit the wrong button on accident).
- The “floor” is the worst performance. If you’re doing a two-alternative forced-choice task, the worst a person can do is 50%, which they would get by guessing. If you’re doing a simple yes/no task (presenting a stimulus on every trial, and the participants says “yes” if they detect it), the floor is 0%.
- The middle is the most interesting part. This is where a person begins to detect the changes, but not all the time.
- You determine the threshold by picking a performance criterion (e.g., 80% correct); the threshold is the stimulus value (intensity or difference) that resulted in criterion performance.
One thing we want to learn from a psychometric function is whether a person’s detection (or discrimination) threshold is high because the average neural response to the stimulus is weak or because there is a lot of variability in the responses. Thresholds are higher when response doesn’t depend very strongly on stimulus. Thresholds are also higher when responses are highly variable—even a big change isn’t reliably detected. The slope of the psychometric function (for a single stimulus level) indicates the level of perceptual noise, or the variability of the responses. So when comparing different population groups, if one tends to have higher thresholds than the other, we can use the slope to tell whether the difference is caused by reduced response amplitude or increased noise (Park, 2017; Reynolds, 2009).
If you would like to learn more, here is another creative commons source covering psychometric functions, or check out this recorded lecture.
Threshold is the lowest point at which a stimulus will cause a response to an organism
Provided by: University of Minnesota
License: CC Attribution 4.0
References:
Park WJ, Schauder KB, Zhang R, Bennetto L, Tadin D (2017). High internal noise and poor external noise filtering characterize perception in autism spectrum disorder. Sci Rep.7(1):17584.Quantification of how well people detect patterns in noisy backgrounds tells us that autism is associated with increased internal noise and decreased ability to filter out external noise.
Reynolds, JH and Heeger DJ (2009). The normalization model of attention. Neuron 29;61(2):168-85.Studying how the psychometric function shifts when people pay attention to or ignore a stimulus revealed one of the neural mechanisms by which attention improves performance.
