
The Mechanics of Hearing
45 Pitch is Frequency
Learning Objectives
Know the physical characteristic of sound waves that pitch is related to and its unit.
Be able to describe the relationship between pitch, frequency, and wavelength.
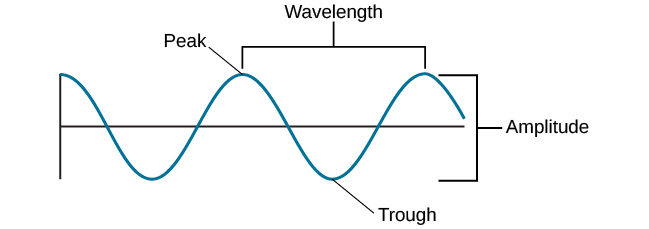
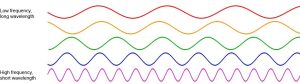
Visual and auditory stimuli both occur in the form of waves. Although the two stimuli are very different in terms of composition, waveforms share similar characteristics that are especially important to our visual and auditory perceptions. In this section, we focus on the physical properties of the auditory waves. Two physical characteristics of a wave are amplitude and wavelength. The amplitude of a wave is the height of a wave as measured from the highest point on the wave (peak or crest) to the lowest point on the wave (trough). Wavelength refers to the length of a wave from one peak to the next (Fig.5.3.1). Wavelength is directly related to the frequency of a given waveform. Frequency refers to the number of waves that pass a given point in a given time period and is often expressed in terms of hertz (Hz), or cycles per second. Longer wavelengths will have lower frequencies, and shorter wavelengths will have higher frequencies.
The frequency of a sound wave is associated with our perception of that sound’s pitch. High-frequency sound waves are perceived as high-pitched sounds, while low-frequency sound waves are perceived as low-pitched sounds. The audible range of sound frequencies is between 20 and 20000 Hz, with greatest sensitivity to those frequencies that fall in the middle of this range. Different organisms have different auditory sensitivity. For example, chickens have a very limited audible range, from 125 to 2000 Hz. Mice have an audible range from 1000 to 91000 Hz, and the beluga whale’s audible range is from 1000 to 123000 Hz. Our pet dogs and cats have audible ranges of about 70–45000 Hz and 45–64000 Hz, respectively (Strain, 2003).
CC LICENSED CONTENT, SHARED PREVIOUSLY
OpenStax, Psychology Chapter 5.2 Waves and Wavelengths
Provided by: Rice University.
Download for free at: https://cnx.org/contents/Sr8Ev5Og@12.2:K-DZ-03P@12/5-1-Sensation-versus-Perception.
License: Creative Commons Attribution 4.0
Adapted by: Cassie Kiehl & Emily Ceplina
