
Vision Loss and V1
91 Low Vision
Learning Objectives
Know the definition of low vision and legal blindness.
Know the prevalence of low vision.
Being able to explain why we are still expecting more low vision people in our society given that we have better and more treatments for many eye diseases.
Low vision is defined as the visual acuity in one’s best eye being worse than 20/60 even with correction. Low vision occurs in 2% of the worldwide population (around 124 million people). The World Health Organization states that at least 2.2 billion people globally experience some form of near or distance vision impairment. Half of these cases, amounting to approximately 1 billion, could have been prevented or addressed but remain unaddressed.
For one to be considered legally blind, the visual acuity of their best eye must be worse than 20/200 or have only 20 degree useful visual field. An estimated 3.8% of the world’s population was estimated in 2020 to have visual impairment, while an estimated 0.6% of the worldwide population is blind (Pesudovs et al, 2024).
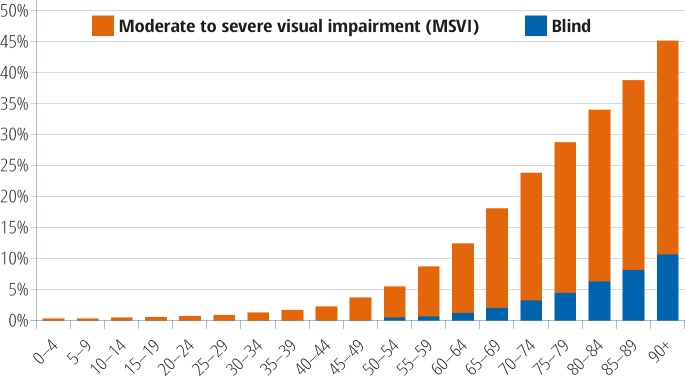
Despite significant advancements in treatments and interventions for vision impairment, the World Health Organization (WHO) states that the prevalence of low vision and blindness is expected to rise due to a combination of demographic changes and health trends. The global increase in population, the aging demographic, and the rising prevalence of chronic conditions such as diabetes, which significantly contribute to vision problems, are attributed to this expected growth. The aging demographic is especially concerning as vision impairment and blindness predominantly affect those over the age of 50 years. With life expectancy on the rise, the segment of the population at risk for age-related eye conditions, including cataracts, glaucoma, and macular degeneration, is expanding.
With the youngest of the baby boomers hitting 65 by 2029, the number of people with visual impairment or blindness in the United States is expected to double to more than 8 million by 2050, according to projections based on the most recent census data and from studies funded by the National Eye Institute (part of the National Institutes of Health).
The data tell us that we should prepare for the surge in visual impairment by implementing further nationwide screening in order to identify people with correctable vision problems and early signs of eye disease. Early detection and intervention could be one of the best options in our attempt to avoid a significant proportion of avoidable vision loss (Fig.9.1.1). Once low vision or blindness occur, they are usually permanent, making early detection and intervention one of the top priorities in our attempt to avoid a significant proportion of avoidable vision loss.

Cheryl Olman PSY 3031 Detailed Outline
Provided by: University of Minnesota
Download for free at http://vision.psych.umn.edu/users/caolman/courses/PSY3031/
License of original source: CC Attribution 4.0
Adapted by: Mckenzie RobertsCONTENT SHARED PREVIOUSLY
National Eye Institute, “Visual impairment, blindness cases in U.S. expected to double by 2050”
URL: https://www.nei.nih.gov/about/news-and-events/news/visual-impairment-blindness-cases-us-expected-double-2050
License: PDM
Adapted by: Mckenzie Roberts and Connor Schreck
Reference
Pesudovs, K., Lansingh, V.C., Kempen, J.H. et al. Global estimates on the number of people blind or visually impaired by cataract: a meta-analysis from 2000 to 2020. Eye(2024). https://doi.org/10.1038/s41433-024-02961-1
Varma, R et al, “Visual impairment and blindness in adults in the United States: Demographic and Geographic Variations from 2015 to 2050,” JAMA Ophthalmology, DOI:10.1001/jamaophthalmol.2016.1284 Pubmed
