
Module 4: Polymerase Chain Reaction (PCR)
Module 4.3: Interpretation of Results
Interpretation of results
In veterinary medicine, one of the most common PCR reaction modalities is Real-Time PCR (RT-PCR) in which sample amplification is detected by the accumulation of a fluorescence signal after every cycle (thus we can monitor it in real-time). This is in contrast with conventional PCR, where we can only verify amplification using gel electrophoresis after the 40 cycles.
The value or result that is generated and reported to the veterinarian is called the cycle threshold (Ct). The Ct is defined as the number of cycles required for a fluorescent signal to cross the threshold (i.e. exceed background level). This means that the Ct level is inversely proportional to the amount of DNA in the sample. In other words, the lower the Ct level, the greater the amount of the target DNA is present in the sample.
Let’s take a look at an example of the graph (below) generated in the lab from an RT-PCR reaction.
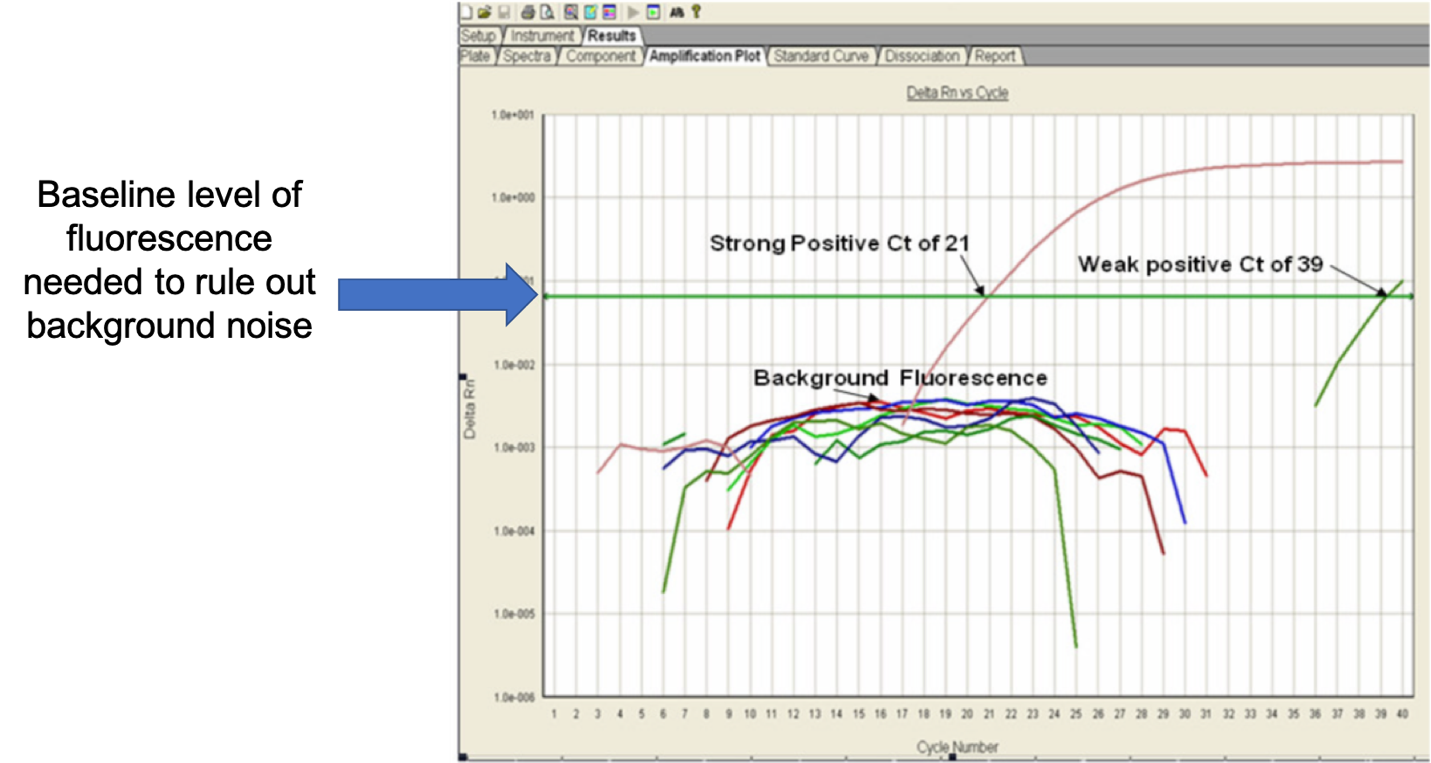
Let’s orient ourselves to the graph above. This graph has several samples running at once for comparison of data. Each colored line represents a single sample except for the straight green line (denoted) which is the threshold of fluorescence needed to exceed rule out background noise.
In this laboratory, they run each sample for 40 cycles (X-axis), and along the Y-axis is the fluorescence level emitted by the DNA amplified.
Taking a look at the data, we have two samples that penetrate the fluorescence threshold and considered true positive reactions. For the red sample, it took 21 amplification cycles (Ct) to reach the fluorescence threshold and for the green sample, it took 39 Ct’s. Since it took fewer cycles to detect the DNA for the red sample, we can say that the red sample contains more DNA than the green sample. This is specific for this run, samples from two different runs should not be compared (e.g. sample A from run 1 had a Ct of 20 and sample B from run 2 had a Ct of 30 does not mean that sample B has less DNA than sample A).
For this sample type, the reference laboratory has set up a reference interval for the evaluation of the data. These reference intervals are laboratory and sample source-specific so you cannot compare quantified PCR results across laboratories or different source types.
Results for the above reactions
Red sample:
Ct: 21
Green sample:
Ct: 39
Laboratory Reference Interval Interpretation
Cts < 29 are strong positive reactions indicative of abundant target nucleic acid in the sample Cts of 30-37 are positive reactions indicative of moderate amounts of target nucleic acid Cts of 38-40 are weak reactions indicative of minimal amounts of target nucleic acid which could represent an infection state or environmental contamination
Based on the laboratory reference intervals we can say that the red sample is a strong positive and we are confident that there is a large amount of the targeted DNA present in this sample. For the green sample, it was a weak positive and there is a small amount of the targeted DNA present in this sample, or it is a product of environmental contamination. This should be interpreted with caution. What we cannot determine for PCR is if this DNA detected is from a viable or alive organism or not only that there is targeted DNA present.
